OPEN-SOURCE SCRIPT
업데이트됨 ATH/ATL tracker
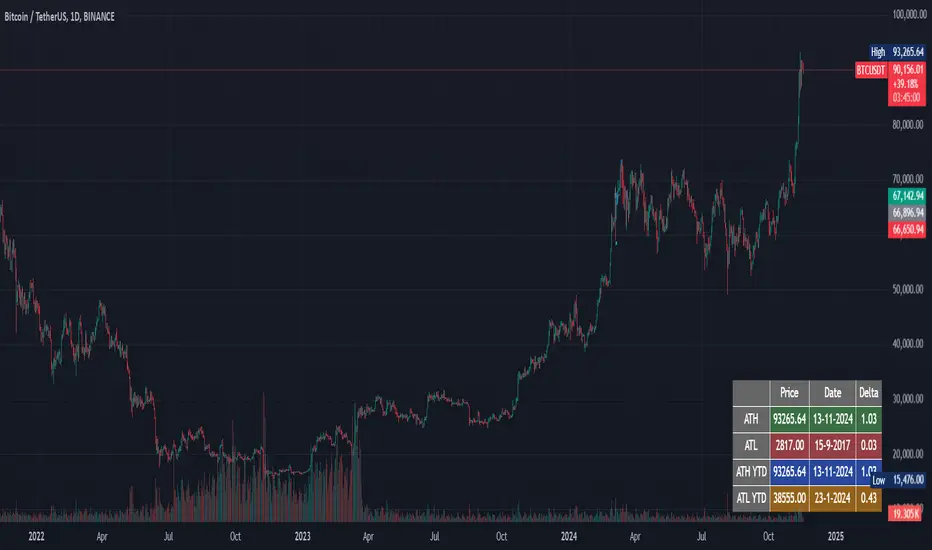
This script calculates and displays in a table in realtime:
- ATH, date of occurrence, and that price/current price
- ATL, date of occurrence, and that price/current price
- ATH of the current year, date of occurrence, and that price/current price
- ATL of the current year, date of occurrence, and that price/current price
- ATH, date of occurrence, and that price/current price
- ATL, date of occurrence, and that price/current price
- ATH of the current year, date of occurrence, and that price/current price
- ATL of the current year, date of occurrence, and that price/current price
릴리즈 노트
This script calculates and displays in a table in realtime:- ATH, date of occurrence, and that price/current price
- ATL, date of occurrence, and that price/current price
- ATH of the current year, date of occurrence, and that price/current price
- ATL of the current year, date of occurrence, and that price/current price
It can also display ATH and ATL levels, but that Style option is by default turned off.
릴리즈 노트
“Comprehensive ATH/ATL Tracker” is a Pine Script indicator designed to track and display the All-Time High (ATH) and All-Time Low (ATL) prices of a security, along with their respective dates. Additionally, it provides the highest and lowest prices for the current year (Year-To-Date, YTD). This script is particularly useful for traders and analysts who want to keep an eye on significant price levels and their historical context.Functionality:
- All-Time High/Low Tracking: The script calculates and displays the highest and lowest prices ever recorded for the security.
- Yearly High/Low Tracking: It also tracks the highest and lowest prices for the current year.
- Delta Calculation: The script calculates the percentage difference (delta) between the current price and the ATH/ATL prices.
- Visual Representation: Users can choose to display these levels on the chart and in a table format for easy reference.
How It Works:
1. Inputs: The script allows users to toggle the display of ATH, ATL, and a statistics table.
2. Functions:
- get_all_time_high() and get_all_time_low() functions iterate through historical data to find the ATH and ATL.
- get_yearly_high(year) and get_yearly_low(year) functions find the highest and lowest prices for a specified year.
3. Data Request: The script uses request.security() to fetch ATH, ATL, and YTD high/low data.
4. Delta Calculation: It calculates the delta values as the percentage difference between the ATH/ATL prices and the current closing price.
5. Plotting:
- If enabled, the script plots horizontal lines at the ATH and ATL levels.
- It creates a table at the bottom-right of the chart displaying the ATH, ATL, YTD high, and YTD low prices, their dates, and the delta values.
Usage Instructions:
1. Add the Indicator: Apply the “Comprehensive ATH/ATL Tracker” indicator to your TradingView chart.
2. Configure Settings: Use the input options to toggle the display of ATH, ATL, and the statistics table.
3. Interpret the Data:
- The horizontal lines (if enabled) will show the ATH and ATL levels directly on the chart.
- The table will provide a detailed view of these levels, including their dates and the percentage difference from the current price.
Concepts Underlying the Calculations:
- All-Time High/Low: These are the highest and lowest prices ever recorded for the security, providing key levels of historical significance.
- Year-To-Date High/Low: These levels help traders understand the security’s performance within the current year.
- Delta: The percentage difference between the current price and the ATH/ATL levels, offering insight into how far the price has moved from these significant levels.
This script is a powerful tool for traders who want to keep track of critical price levels and their historical context, aiding in making informed trading decisions.
오픈 소스 스크립트
트레이딩뷰의 진정한 정신에 따라, 이 스크립트의 작성자는 이를 오픈소스로 공개하여 트레이더들이 기능을 검토하고 검증할 수 있도록 했습니다. 작성자에게 찬사를 보냅니다! 이 코드는 무료로 사용할 수 있지만, 코드를 재게시하는 경우 하우스 룰이 적용된다는 점을 기억하세요.
면책사항
해당 정보와 게시물은 금융, 투자, 트레이딩 또는 기타 유형의 조언이나 권장 사항으로 간주되지 않으며, 트레이딩뷰에서 제공하거나 보증하는 것이 아닙니다. 자세한 내용은 이용 약관을 참조하세요.
오픈 소스 스크립트
트레이딩뷰의 진정한 정신에 따라, 이 스크립트의 작성자는 이를 오픈소스로 공개하여 트레이더들이 기능을 검토하고 검증할 수 있도록 했습니다. 작성자에게 찬사를 보냅니다! 이 코드는 무료로 사용할 수 있지만, 코드를 재게시하는 경우 하우스 룰이 적용된다는 점을 기억하세요.
면책사항
해당 정보와 게시물은 금융, 투자, 트레이딩 또는 기타 유형의 조언이나 권장 사항으로 간주되지 않으며, 트레이딩뷰에서 제공하거나 보증하는 것이 아닙니다. 자세한 내용은 이용 약관을 참조하세요.