INVITE-ONLY SCRIPT
Relative Strength Index by YSTC
This is a PAID Indicator from Volume Profile and VWAP Pack.
According to payment you will either get a TradingView account with indicators activated or
Have to send an email to contact@ystc.in with the email you used to sign up with us, and with your TradingView Username.
The script is available (for free) to YSTC's Course members of "Trading with PAV".
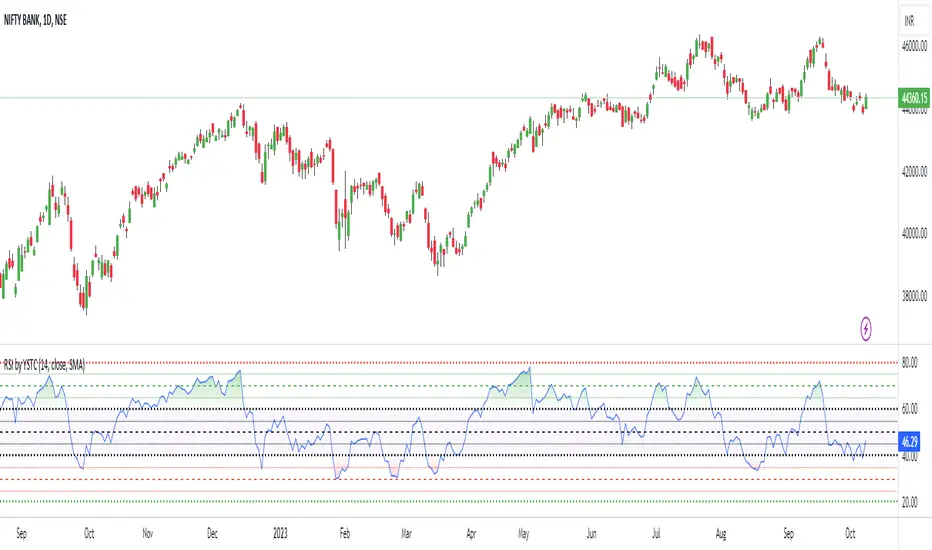
Relative Strength Index (RSI)
A momentum based oscillator which is used to measure the speed (velocity) as well as the change (magnitude) of directional price movements.
What Different about this RSI by YSTC.
You get Support and Resistance lines for RSI which are 20, 30, 40, 50, 60, 70, 80. as shown below.

It can also show RSI Candles as shown below.

For those who want all types of MA with MA Cross can play with this indicator. Below is MA Cross of 9, 21.

And for NEW user with untrained eyes who cant yet detect Divergence this indicator Saves you the trouble of finding.
Below is Regular Bullish and Bearish Divergence. Linewidth 2.

Below is Hidden Bullish and Bearish Divergence. Linewidth 1.

You can add this script to your chart by clicking "Add to favorite indicators" below.
Have Questions ?
contact@ystc.in
Free Stock Market Introduction Available.
Name: Yogesh Patil (YS Trading Coach).
Contact: +91 9637070868.
Time: Monday to Friday (10:00 AM - 07:00 PM).
According to payment you will either get a TradingView account with indicators activated or
Have to send an email to contact@ystc.in with the email you used to sign up with us, and with your TradingView Username.
The script is available (for free) to YSTC's Course members of "Trading with PAV".
Relative Strength Index (RSI)
A momentum based oscillator which is used to measure the speed (velocity) as well as the change (magnitude) of directional price movements.
What Different about this RSI by YSTC.
You get Support and Resistance lines for RSI which are 20, 30, 40, 50, 60, 70, 80. as shown below.
It can also show RSI Candles as shown below.
For those who want all types of MA with MA Cross can play with this indicator. Below is MA Cross of 9, 21.
And for NEW user with untrained eyes who cant yet detect Divergence this indicator Saves you the trouble of finding.
Below is Regular Bullish and Bearish Divergence. Linewidth 2.
Below is Hidden Bullish and Bearish Divergence. Linewidth 1.
You can add this script to your chart by clicking "Add to favorite indicators" below.
Have Questions ?
contact@ystc.in
Free Stock Market Introduction Available.
Name: Yogesh Patil (YS Trading Coach).
Contact: +91 9637070868.
Time: Monday to Friday (10:00 AM - 07:00 PM).
초대 전용 스크립트
이 스크립트는 작성자가 승인한 사용자만 접근할 수 있습니다. 사용하려면 요청 후 승인을 받아야 하며, 일반적으로 결제 후에 허가가 부여됩니다. 자세한 내용은 아래 작성자의 안내를 따르거나 YSTradingCoach에게 직접 문의하세요.
이 비공개 초대 전용 스크립트는 스크립트 모더레이터의 검토를 거치지 않았으며, 하우스 룰 준수 여부는 확인되지 않았습니다. 트레이딩뷰는 스크립트의 작동 방식을 충분히 이해하고 작성자를 완전히 신뢰하지 않는 이상, 해당 스크립트에 비용을 지불하거나 사용하는 것을 권장하지 않습니다. 커뮤니티 스크립트에서 무료 오픈소스 대안을 찾아보실 수도 있습니다.
작성자 지시 사항
A PAID Indicator from Volume Profile and VWAP Pack.
According to payment you will either get a TradingView account with indicators activated or
Have to send an email to contact@ystc.in with the email you used to sign up with us, and your TV username.
면책사항
해당 정보와 게시물은 금융, 투자, 트레이딩 또는 기타 유형의 조언이나 권장 사항으로 간주되지 않으며, 트레이딩뷰에서 제공하거나 보증하는 것이 아닙니다. 자세한 내용은 이용 약관을 참조하세요.