INVITE-ONLY SCRIPT
업데이트됨 Colored Stacked EMA Ribbon
This script is my interpretation of an idea from John Carter in his interview with Richard Moglen.
The idea of moving average ribbons or simply multiple moving averages has been around since moving averages were created. But many of these ideas, such as the Guppy Multiple Moving Averages focus on price closes above a moving average (or multiple moving averages).
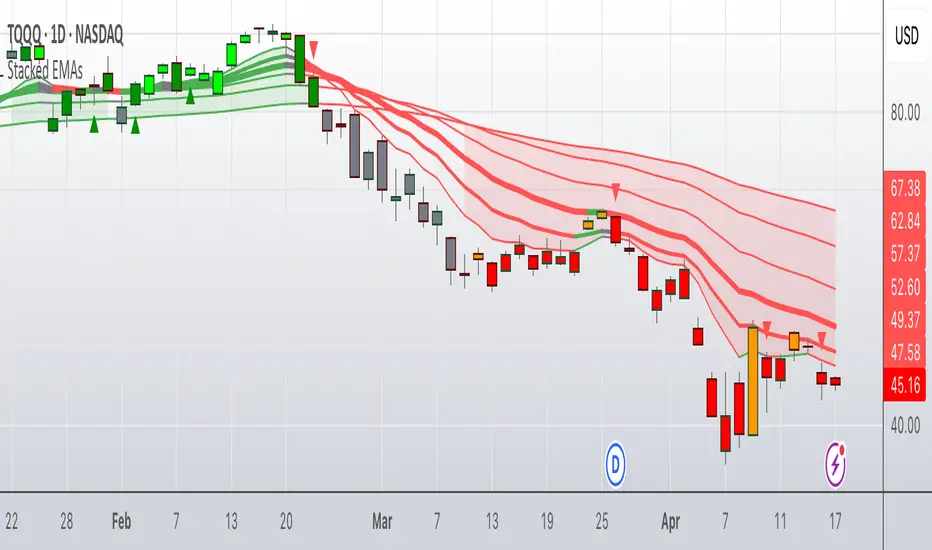
In this version, the idea is that the EMAs are compared to each other from shortest to longest. In a completely bullish alignment, the EMAs are referred to as "stacked" in which, for example, the 8 EMA > 13 EMA, the 13 EMA > 21 EMA and so on. When the EMAs are "stacked" in a fully bullish alignment, the EMA cloud is filled green. When the EMAs are "stacked" in a fully bearish alignment, the EMA cloud is filled red.
In addition, I've colored the EMA lines themselves according to if they are rising (green) or falling (red) over a user inputted lookback. The default is "1" period, but it is adjustable. (Generally, I use "1" for the lookback.)
When the EMA lines flip from mixed (rising/falling) to all rising, a green triangle is drawn under the bar/candle. Similarly, when the EMA lines flip from mixed (falling/rising) to all falling, a red triangle is drawn over the bar/candle. This gives the user another potential entry in the context of a stacked EMA cloud. It also can give early signals for entry in a neutral cloud.
Candles/bars are colored according to the EMA cloud & EMA line status. So, for example, a bullish stacked EMA cloud (green) and all EMA lines green, will result in a bright green candle color. IF the cloud is green, but the EMA lines are mixed (red/green), this will result in a dark green candle. Similar logic applies to the bearish conditions which result in red (most bearish) or orange (still bearish) candle colors. IF the EMA cloud is neither bullishly stacked or bearishly stacked, then those candles will appear as gray (neutral).
There are many ways to use this script, but it excels in a trending market. John Carter often sets limit buys in an area near the 21D EMA in names that are trending & he wants to get in. The 13D EMA linewidth is set at 2 and the 21D EMA linewidth is set a 3 to easily identify this area. Now, you can "buy the dip" or "short the rip" within the context of a trending market (which the script identifies with green or red EMA clouds). Or you can wait for some confirmation via the green triangle (or something else like a candle stick pattern or trendline break). Remember to set stops in case price goes against you.
1 final note this is not a "magic bullet", but for a single indicator it does alot of work & personally I've found it to be very useful on multiple time frames. I do recommend combining it with volume (or a volume-based indicator).
Update #1: This updated version allows the user to adjust candle colors, forces the script to wait for bar closes on intraday charts (if conditions are met) before plotting triangles, and removes a link to YT. In addition, non-intraday charts (daily, weekly, etc) will flash a triangle intraday (if conditions are met) before updating completely at the close.
The idea of moving average ribbons or simply multiple moving averages has been around since moving averages were created. But many of these ideas, such as the Guppy Multiple Moving Averages focus on price closes above a moving average (or multiple moving averages).
In this version, the idea is that the EMAs are compared to each other from shortest to longest. In a completely bullish alignment, the EMAs are referred to as "stacked" in which, for example, the 8 EMA > 13 EMA, the 13 EMA > 21 EMA and so on. When the EMAs are "stacked" in a fully bullish alignment, the EMA cloud is filled green. When the EMAs are "stacked" in a fully bearish alignment, the EMA cloud is filled red.
In addition, I've colored the EMA lines themselves according to if they are rising (green) or falling (red) over a user inputted lookback. The default is "1" period, but it is adjustable. (Generally, I use "1" for the lookback.)
When the EMA lines flip from mixed (rising/falling) to all rising, a green triangle is drawn under the bar/candle. Similarly, when the EMA lines flip from mixed (falling/rising) to all falling, a red triangle is drawn over the bar/candle. This gives the user another potential entry in the context of a stacked EMA cloud. It also can give early signals for entry in a neutral cloud.
Candles/bars are colored according to the EMA cloud & EMA line status. So, for example, a bullish stacked EMA cloud (green) and all EMA lines green, will result in a bright green candle color. IF the cloud is green, but the EMA lines are mixed (red/green), this will result in a dark green candle. Similar logic applies to the bearish conditions which result in red (most bearish) or orange (still bearish) candle colors. IF the EMA cloud is neither bullishly stacked or bearishly stacked, then those candles will appear as gray (neutral).
There are many ways to use this script, but it excels in a trending market. John Carter often sets limit buys in an area near the 21D EMA in names that are trending & he wants to get in. The 13D EMA linewidth is set at 2 and the 21D EMA linewidth is set a 3 to easily identify this area. Now, you can "buy the dip" or "short the rip" within the context of a trending market (which the script identifies with green or red EMA clouds). Or you can wait for some confirmation via the green triangle (or something else like a candle stick pattern or trendline break). Remember to set stops in case price goes against you.
1 final note this is not a "magic bullet", but for a single indicator it does alot of work & personally I've found it to be very useful on multiple time frames. I do recommend combining it with volume (or a volume-based indicator).
Update #1: This updated version allows the user to adjust candle colors, forces the script to wait for bar closes on intraday charts (if conditions are met) before plotting triangles, and removes a link to YT. In addition, non-intraday charts (daily, weekly, etc) will flash a triangle intraday (if conditions are met) before updating completely at the close.
릴리즈 노트
I. How the Colored Stacked EMA Ribbon Adds Value:The "Colored Stacked EMA Ribbon" is a Pine Script v5 indicator that simplifies trend analysis with vibrant visuals and precise alerts. Its intuitive design and versatile features make it a standout addition to the TradingView Community Scripts:
Clear Trend Visualization: Six EMAs are plotted with dynamic colors (green for rising, red for falling, gray for flat) and a semi-transparent cloud, highlighting bullish or bearish trends at a glance.
Strong Trade Signals: Candlestick colors and triangle markers signal when EMAs align bullishly or bearishly, or when all are rising/falling, guiding trade entries and exits.
New Actionable Alerts: Alerts trigger for all EMAs rising, falling, or forming bullish/bearish stacks, enabling traders to capture key trend shifts instantly.
Customizable Design: Adjustable EMA periods and lookback settings suit various markets and trading styles, from scalping to swing trading.
Community Learning: Its clear logic offers a valuable resource for Pine Script learners to explore advanced indicator design.
By blending trend clarity, reliable signals, and smart alerts, the EMA Ribbon empowers traders and enriches the TradingView community.
II. What It Does, How It Works, and Its Originality:
What It Does
The Colored Stacked EMA Ribbon enhances trend trading with three key features:
Dynamic EMA Display: Shows six EMAs with trend-based colors and a cloud between the fastest and slowest, reflecting market direction.
Stacking and Trend Signals: Colors candlesticks and plots triangles when EMAs align bullishly/bearishly or all rise/fall, signaling trade opportunities.
Advanced Alerts: Notifies traders when all EMAs rise, fall, or form bullish/bearish stacks, capturing critical trend changes.
How It Works:
The script uses Pine Script v5 for clear visuals and reliable alerts:
Setup: Users customize six EMA periods and a lookback for trend detection.
Visualization: EMAs are colored by trend, with varying line widths. A cloud shows bullish (green) or bearish (red) alignment. Candlesticks reflect stacking and trend strength.
Signals and Alerts: Triangles mark when all EMAs rise (green) or fall (red) on confirmed bars. Alerts trigger for rising/falling EMAs and new bullish/bearish stacks, firing only on transitions for precision.
Why It’s Original
The EMA Ribbon stands out with its unique blend of features:
Holistic Trend Insight: Combines colored EMAs, a cloud, and candlestick coloring to show trend strength and alignment, unlike basic EMA indicators.
Specialized Alerts: New alerts for all EMAs rising/falling and bullish/bearish stacking pinpoint key moments, a rare feature in similar tools.
Reliable Signals: Non-repainting signals on confirmed bars ensure trustworthiness for live trading.
User-Friendly Design: Customizable settings and a clean interface make it versatile and accessible.
While EMA ribbons exist, this script’s stacking focus, nuanced visuals, and precise alerts create a fresh, practical tool for traders and learners alike.
초대 전용 스크립트
이 스크립트는 작성자가 승인한 사용자만 접근할 수 있습니다. 사용하려면 요청 후 승인을 받아야 하며, 일반적으로 결제 후에 허가가 부여됩니다. 자세한 내용은 아래 작성자의 안내를 따르거나 weeklystockcharts에게 직접 문의하세요.
트레이딩뷰는 스크립트의 작동 방식을 충분히 이해하고 작성자를 완전히 신뢰하지 않는 이상, 해당 스크립트에 비용을 지불하거나 사용하는 것을 권장하지 않습니다. 커뮤니티 스크립트에서 무료 오픈소스 대안을 찾아보실 수도 있습니다.
작성자 지시 사항
Script is free.
Just mention my YT channel name in your request & you're in.
Thanks!
면책사항
해당 정보와 게시물은 금융, 투자, 트레이딩 또는 기타 유형의 조언이나 권장 사항으로 간주되지 않으며, 트레이딩뷰에서 제공하거나 보증하는 것이 아닙니다. 자세한 내용은 이용 약관을 참조하세요.