OPEN-SOURCE SCRIPT
Whisker Reversal Oscillator [SpiritualHealer117]
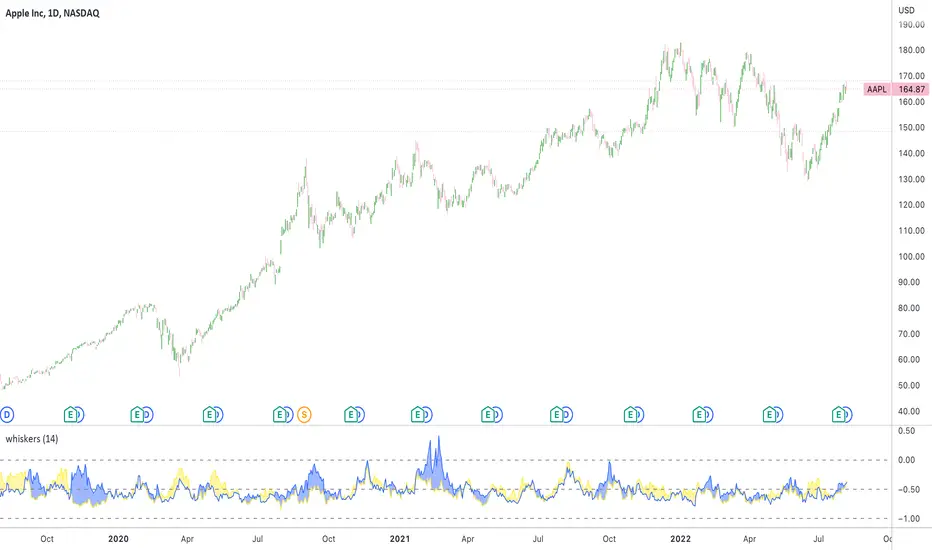
The Whisker Reversal Oscillator can be used to spot strength or weakness in trends. It is designed for stocks, commodities and forex trading, and is intended to be calculated from the high, close, low, and open over a given length.
Features:
The Whisker Reversal Oscillator shows the average length of the top and bottom whiskers on candlesticks over a defined length. It plots the percentage difference between the whiskers and the length of the body, with the yellow line representing the average length of the top whisker, and the bottom line indicating the average length of the bottom whisker.
Interpreting the signals:
The Whisker Reversal Oscillator is interpreted in the same way as a candlestick reversal pattern, where it being bullish or bearish depends on the trend. In a bull trend, if the yellow line passes above the blue line, it means the top whiskers are longer on average than the bottom whiskers, which may show that bulls were too weak to hold a rally, and signal a reversal. On the other hand, in a bear trend, if the yellow line is above the blue line, it indicates that the bulls were able to push the price up, which would be bullish. If the blue line crosses over the yellow line in an uptrend, it's often a bearish sign, but if it happens in a downtrend, its a bullish sign.
Generally speaking, a cross in the lines is indicative of a potential reversal, and when the lines cross over 1, it means that the whiskers were bigger than the candlestick bodies over your selected length, indicating that a big swing will come.
오픈 소스 스크립트
트레이딩뷰의 진정한 정신에 따라, 이 스크립트의 작성자는 이를 오픈소스로 공개하여 트레이더들이 기능을 검토하고 검증할 수 있도록 했습니다. 작성자에게 찬사를 보냅니다! 이 코드는 무료로 사용할 수 있지만, 코드를 재게시하는 경우 하우스 룰이 적용된다는 점을 기억하세요.
면책사항
해당 정보와 게시물은 금융, 투자, 트레이딩 또는 기타 유형의 조언이나 권장 사항으로 간주되지 않으며, 트레이딩뷰에서 제공하거나 보증하는 것이 아닙니다. 자세한 내용은 이용 약관을 참조하세요.
오픈 소스 스크립트
트레이딩뷰의 진정한 정신에 따라, 이 스크립트의 작성자는 이를 오픈소스로 공개하여 트레이더들이 기능을 검토하고 검증할 수 있도록 했습니다. 작성자에게 찬사를 보냅니다! 이 코드는 무료로 사용할 수 있지만, 코드를 재게시하는 경우 하우스 룰이 적용된다는 점을 기억하세요.
면책사항
해당 정보와 게시물은 금융, 투자, 트레이딩 또는 기타 유형의 조언이나 권장 사항으로 간주되지 않으며, 트레이딩뷰에서 제공하거나 보증하는 것이 아닙니다. 자세한 내용은 이용 약관을 참조하세요.