OPEN-SOURCE SCRIPT
업데이트됨 Volatility Momentum Score | Lyro RS
Volatility Momentum Score | Lyro RS
Overview
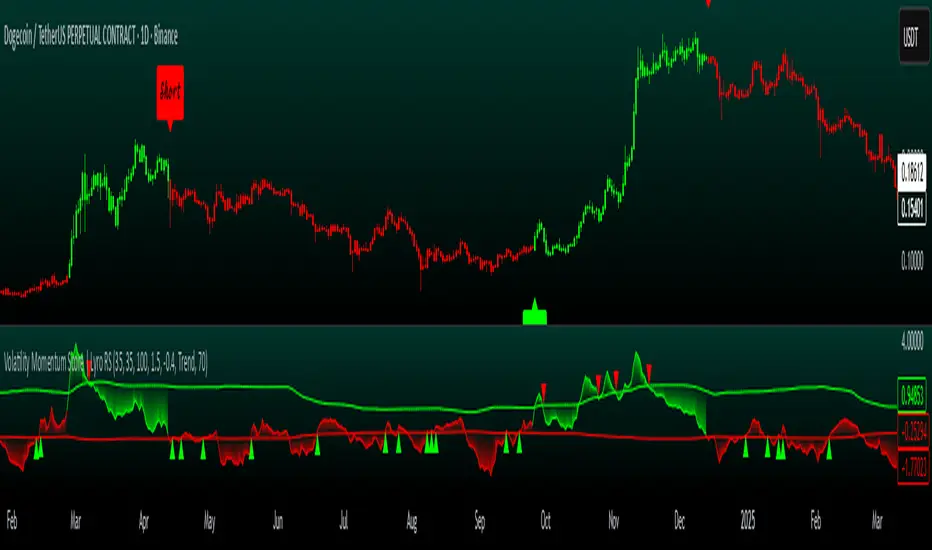
The Volatility Momentum Score (VMS) combines price movement and volatility into a single, easy-to-read signal. Using z-scores, standard deviation bands, and flexible display modes, it helps traders identify trends, overbought/oversold conditions, and potential reversals quickly and effectively.
Key Features
How It Works
Practical Use
Customization
⚠️ Disclaimer
This indicator is a technical analysis tool and does not guarantee results. It should be used alongside other methods and proper risk management. The creators are not responsible for any financial decisions based on its signals.
Overview
The Volatility Momentum Score (VMS) combines price movement and volatility into a single, easy-to-read signal. Using z-scores, standard deviation bands, and flexible display modes, it helps traders identify trends, overbought/oversold conditions, and potential reversals quickly and effectively.
Key Features
- Price + Volatility Blend
Tracks price action and volatility with separate z-scores and merges them into a unified momentum score. - Standard Deviation Bands
Upper and lower bands highlight extreme readings.
Adjustable multipliers allow for fine-tuning sensitivity. - Two Signal Modes
Trend Mode: Plots “Long” and “Short” signals when momentum crosses bands.
Reversion Mode: Colors the chart background when the score indicates stretched conditions. - Overbought & Oversold Alerts
▲ markers indicate oversold conditions.
▼ markers indicate overbought conditions. - Custom Colors
Four preset color themes or fully customizable bullish/bearish colors. - Clear Visuals
Dynamic line coloring based on momentum.
Candles recolored at signal points.
Background shading for quick visual assessment.
How It Works
- Calculates z-scores for both price and volatility.
- Blends the z-scores into a single average score.
- Compares the score against dynamic upper and lower bands.
- Triggers signals, markers, or background shading depending on the chosen display mode.
Practical Use
- Ride trends: Follow Trend Mode signals to align with momentum.
- Spot reversals: Watch ▲ and ▼ markers when markets are overextended.
- Stay aware: Background shading highlights potentially overheated conditions.
Customization
- Set lookback lengths for price, volatility, and bands.
- Adjust band multipliers for more or less sensitive signals.
- Choose between Trend or Reversion mode based on trading style.
- Select color themes or create custom palettes.
⚠️ Disclaimer
This indicator is a technical analysis tool and does not guarantee results. It should be used alongside other methods and proper risk management. The creators are not responsible for any financial decisions based on its signals.
릴리즈 노트
Edited Text.릴리즈 노트
Update: Added Design & chart fix.오픈 소스 스크립트
트레이딩뷰의 진정한 정신에 따라, 이 스크립트의 작성자는 이를 오픈소스로 공개하여 트레이더들이 기능을 검토하고 검증할 수 있도록 했습니다. 작성자에게 찬사를 보냅니다! 이 코드는 무료로 사용할 수 있지만, 코드를 재게시하는 경우 하우스 룰이 적용된다는 점을 기억하세요.
Get access to our private indicators & analysis: whop.com/lyro-rs
Join our community: discord.gg/kcEBMWaFjS
All material from Lyro RS is for educational purposes only. Past performance does not guarantee future results.
Join our community: discord.gg/kcEBMWaFjS
All material from Lyro RS is for educational purposes only. Past performance does not guarantee future results.
면책사항
해당 정보와 게시물은 금융, 투자, 트레이딩 또는 기타 유형의 조언이나 권장 사항으로 간주되지 않으며, 트레이딩뷰에서 제공하거나 보증하는 것이 아닙니다. 자세한 내용은 이용 약관을 참조하세요.
오픈 소스 스크립트
트레이딩뷰의 진정한 정신에 따라, 이 스크립트의 작성자는 이를 오픈소스로 공개하여 트레이더들이 기능을 검토하고 검증할 수 있도록 했습니다. 작성자에게 찬사를 보냅니다! 이 코드는 무료로 사용할 수 있지만, 코드를 재게시하는 경우 하우스 룰이 적용된다는 점을 기억하세요.
Get access to our private indicators & analysis: whop.com/lyro-rs
Join our community: discord.gg/kcEBMWaFjS
All material from Lyro RS is for educational purposes only. Past performance does not guarantee future results.
Join our community: discord.gg/kcEBMWaFjS
All material from Lyro RS is for educational purposes only. Past performance does not guarantee future results.
면책사항
해당 정보와 게시물은 금융, 투자, 트레이딩 또는 기타 유형의 조언이나 권장 사항으로 간주되지 않으며, 트레이딩뷰에서 제공하거나 보증하는 것이 아닙니다. 자세한 내용은 이용 약관을 참조하세요.