INVITE-ONLY SCRIPT
The Real Dynamic Lookback Asaf Biton
The Real Dynamic Lookback – Asaf Biton
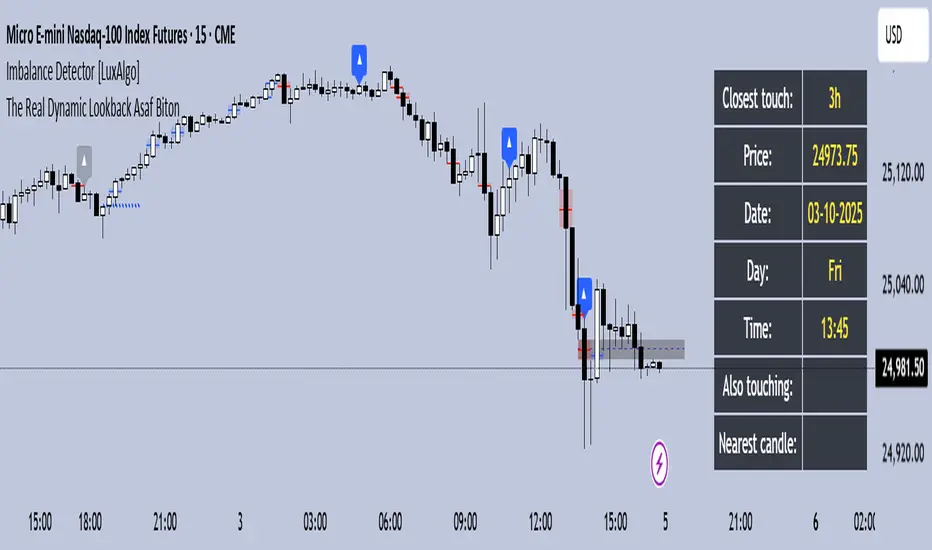
This indicator dynamically tracks historical candles at predefined lookback intervals (in hours) and visually highlights them on the chart.
Dynamic Lookback Arrows: Marks candles from the chosen lookback groups (3h, 6h, 12h, … up to 336h) with arrows. Colors indicate whether the candle falls on the same New York trading day or not.
HUD Panel: Displays real-time information about the closest candle that overlaps with the current price range, including its price, date, day, and time.
Also Touching: If multiple candles overlap with the current bar, the closest one in time is prioritized, and the rest are listed as "Also touching".
Nearest Candle: If no overlap occurs, the HUD shows the nearest candle in terms of price proximity.
Timeframe Restriction: Works only on 15m, 30m, and 1h charts to maintain accuracy.
Customization: Users can enable or disable different lookback groups and toggle HUD/arrows.
This tool is useful for identifying recurring price reactions, time-based cycles, and historical reference points in a structured, visual way.
📌 תיאור בעברית
The Real Dynamic Lookback – אסף ביטון
האינדיקטור מזהה ומציג נרות היסטוריים לפי מחזורי זמן מוגדרים מראש (בשעות), ומסמן אותם באופן ויזואלי על הגרף.
חצים דינמיים: סימון נרות במחזורי זמן נבחרים (3h, 6h, 12h ועד 336h). הצבע משתנה בהתאם אם הנר נמצא באותו יום מסחר בניו יורק או לא.
תצוגת HUD: מציגה בזמן אמת את הנר הקרוב ביותר שנוגע בטווח המחירים של הנר הנוכחי, כולל המחיר, התאריך, היום והשעה.
Also Touching: כאשר יותר מנר אחד נוגע בטווח הנר הנוכחי, האינדיקטור נותן עדיפות לנר הקרוב ביותר בזמן ואת השאר מציג ברשימה.
Nearest Candle: אם אין נרות שנוגעים במחיר הנוכחי, מוצג הנר הקרוב ביותר מבחינת מרחק מחיר.
מגבלת טיים פריים: עובד אך ורק על גרפים של 15 דקות, 30 דקות או שעה, לשמירה על דיוק.
התאמה אישית: ניתן לבחור אילו קבוצות מחזורי זמן להפעיל ולהחליט האם להציג חצים ו-HUD.
האינדיקטור מיועד לניתוח חזרות מחירים, מחזורי זמן והשוואה לנקודות היסטוריות בצורה ברורה ונוחה.
초대 전용 스크립트
이 스크립트는 작성자가 승인한 사용자만 접근할 수 있습니다. 사용하려면 요청 후 승인을 받아야 하며, 일반적으로 결제 후에 허가가 부여됩니다. 자세한 내용은 아래 작성자의 안내를 따르거나 asafbiton1에게 직접 문의하세요.
트레이딩뷰는 스크립트의 작동 방식을 충분히 이해하고 작성자를 완전히 신뢰하지 않는 이상, 해당 스크립트에 비용을 지불하거나 사용하는 것을 권장하지 않습니다. 커뮤니티 스크립트에서 무료 오픈소스 대안을 찾아보실 수도 있습니다.
작성자 지시 사항
The Real Dynamic Lookback – Asaf Biton
This indicator dynamically tracks historical candles at predefined lookback intervals (in hours) and visually highlights them on the chart.
Dynamic Lookback Arrows: Marks candles from the chosen lookback groups (3h,
면책사항
해당 정보와 게시물은 금융, 투자, 트레이딩 또는 기타 유형의 조언이나 권장 사항으로 간주되지 않으며, 트레이딩뷰에서 제공하거나 보증하는 것이 아닙니다. 자세한 내용은 이용 약관을 참조하세요.