INVITE-ONLY SCRIPT
Zentrading Trend Follower
Our Trend following indicator is designed to get you in every trend safely, but perhaps most importantly, keeps you out of bad trades.
It performs well on all assets as it captures trending moves.
It does not only provide you with buy or sell signals you have to react on quickly, rather, it shows you when a trade setup is active. In this way you can anticipate the break of the breakout level to enter the trade. A trailing stop loss is used to exit.
It will work on all timeframes, but as lower timeframes add more noise to the market there will naturally be more losing trades than on higher timeframes. We recommend using it on anywhere from the weekly down to 1 or 2 HR -0.44% timeframes.
It is very simple to use:
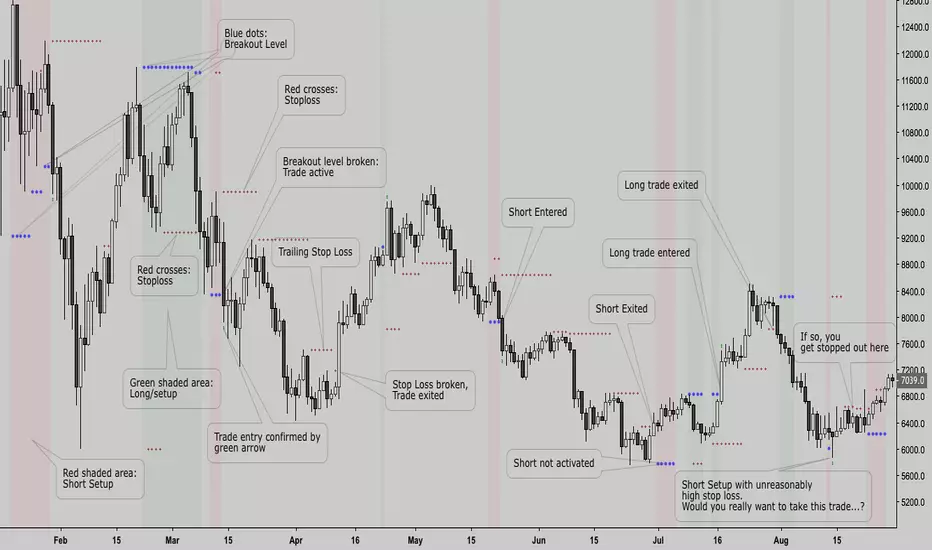
The shaded areas on the chart indicate that a trade setup has been detected: Green for bullish setups, red for bearish setups.
The blue dots are plotted as the breakout level, if the price breaks this level the trade is entered. (as you can see on the chart, they can sometimes move towards the price!)
Red crosses are plotted as your trailing stop loss, if price breaks the stop loss the trade is closed.
This is a subscription indicator, please pm for information on how to access.
Happy trading!
It performs well on all assets as it captures trending moves.
It does not only provide you with buy or sell signals you have to react on quickly, rather, it shows you when a trade setup is active. In this way you can anticipate the break of the breakout level to enter the trade. A trailing stop loss is used to exit.
It will work on all timeframes, but as lower timeframes add more noise to the market there will naturally be more losing trades than on higher timeframes. We recommend using it on anywhere from the weekly down to 1 or 2 HR -0.44% timeframes.
It is very simple to use:
The shaded areas on the chart indicate that a trade setup has been detected: Green for bullish setups, red for bearish setups.
The blue dots are plotted as the breakout level, if the price breaks this level the trade is entered. (as you can see on the chart, they can sometimes move towards the price!)
Red crosses are plotted as your trailing stop loss, if price breaks the stop loss the trade is closed.
This is a subscription indicator, please pm for information on how to access.
Happy trading!
초대 전용 스크립트
이 스크립트는 작성자가 승인한 사용자만 접근할 수 있습니다. 사용하려면 요청 후 승인을 받아야 하며, 일반적으로 결제 후에 허가가 부여됩니다. 자세한 내용은 아래 작성자의 안내를 따르거나 DariusZen에게 직접 문의하세요.
트레이딩뷰는 스크립트의 작동 방식을 충분히 이해하고 작성자를 완전히 신뢰하지 않는 이상, 해당 스크립트에 비용을 지불하거나 사용하는 것을 권장하지 않습니다. 커뮤니티 스크립트에서 무료 오픈소스 대안을 찾아보실 수도 있습니다.
작성자 지시 사항
면책사항
해당 정보와 게시물은 금융, 투자, 트레이딩 또는 기타 유형의 조언이나 권장 사항으로 간주되지 않으며, 트레이딩뷰에서 제공하거나 보증하는 것이 아닙니다. 자세한 내용은 이용 약관을 참조하세요.