OPEN-SOURCE SCRIPT
[blackcat] L3 Gann Slope
Level 3
Background
William Gann (Wilian D. Gann) is one of the most famous investors in the twentieth century. His outstanding achievements in the stock and futures markets are unparalleled. The theory he created that perfectly combines time and price has been It is still talked about and highly praised by the investment community.
Function
The slope is the degree of the angle line relative to the time axis (X axis). Volatility is the ratio of unit amplitude to unit time. At the heart of Gann angles is the determination of volatility. Gann angle is the movement of price defined by time unit and price unit. Each angle is determined by the relationship between time and price. In the rising angle, the angle with the larger slope means that the stock price is rising stronger and falling. In a trend line, the larger the slope, the stronger the downtrend.
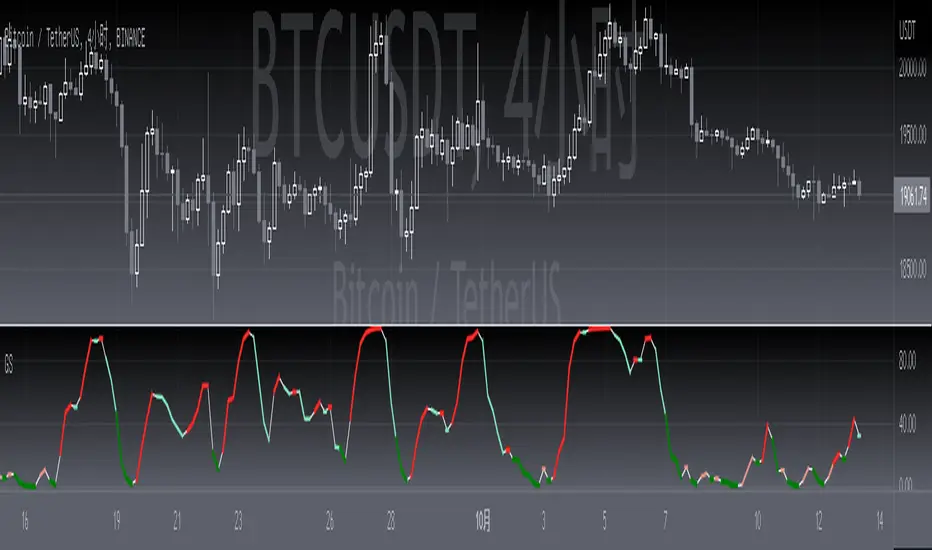
This technical indicator speaks of the Gann slope expressed as an oscillator. Its value varies from 0 to 100. The positive slope means rising, and the negative slope means falling. For rising and falling, the strength of rising and falling is distinguished by the thickness and color of the oscillating line:
1. The thin white line represents the basic oscillator curve and has no special meaning.
2. Light red indicates that an uptrend is established, and dark red indicates a very strong uptrend.
3. Light green indicates an established downtrend, dark green indicates a very strong downtrend.
Remarks
Feedbacks are appreciated.
Background
William Gann (Wilian D. Gann) is one of the most famous investors in the twentieth century. His outstanding achievements in the stock and futures markets are unparalleled. The theory he created that perfectly combines time and price has been It is still talked about and highly praised by the investment community.
Function
The slope is the degree of the angle line relative to the time axis (X axis). Volatility is the ratio of unit amplitude to unit time. At the heart of Gann angles is the determination of volatility. Gann angle is the movement of price defined by time unit and price unit. Each angle is determined by the relationship between time and price. In the rising angle, the angle with the larger slope means that the stock price is rising stronger and falling. In a trend line, the larger the slope, the stronger the downtrend.
This technical indicator speaks of the Gann slope expressed as an oscillator. Its value varies from 0 to 100. The positive slope means rising, and the negative slope means falling. For rising and falling, the strength of rising and falling is distinguished by the thickness and color of the oscillating line:
1. The thin white line represents the basic oscillator curve and has no special meaning.
2. Light red indicates that an uptrend is established, and dark red indicates a very strong uptrend.
3. Light green indicates an established downtrend, dark green indicates a very strong downtrend.
Remarks
Feedbacks are appreciated.
오픈 소스 스크립트
트레이딩뷰의 진정한 정신에 따라, 이 스크립트의 작성자는 이를 오픈소스로 공개하여 트레이더들이 기능을 검토하고 검증할 수 있도록 했습니다. 작성자에게 찬사를 보냅니다! 이 코드는 무료로 사용할 수 있지만, 코드를 재게시하는 경우 하우스 룰이 적용된다는 점을 기억하세요.
Avoid losing contact!Don't miss out! The first and most important thing to do is to join my Discord chat now! Click here to start your adventure: discord.com/invite/ZTGpQJq 防止失联,请立即行动,加入本猫聊天群: discord.com/invite/ZTGpQJq
면책사항
해당 정보와 게시물은 금융, 투자, 트레이딩 또는 기타 유형의 조언이나 권장 사항으로 간주되지 않으며, 트레이딩뷰에서 제공하거나 보증하는 것이 아닙니다. 자세한 내용은 이용 약관을 참조하세요.