PROTECTED SOURCE SCRIPT
[N]RSIOMA
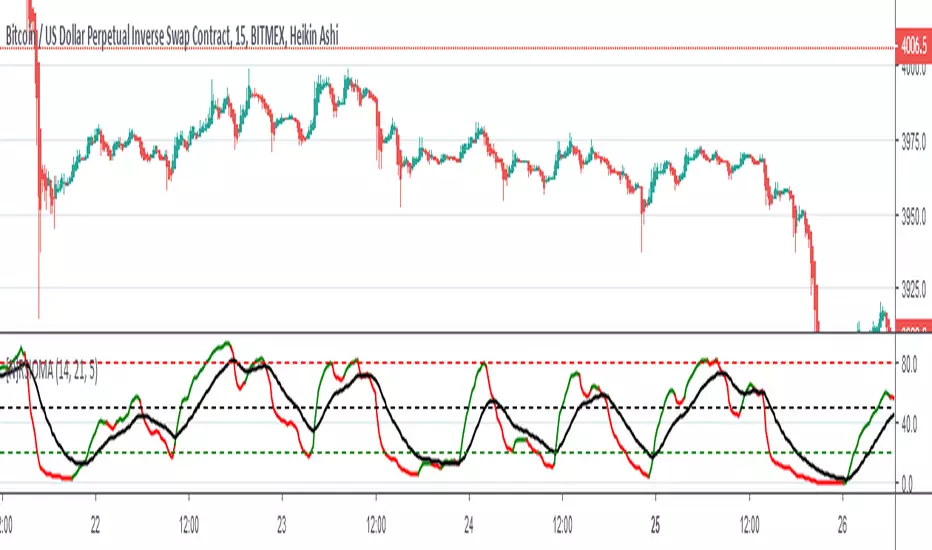
RSIOMA is the abbreviation for Relative Strength index (RSI) of moving averages (MA).
Rules:
RSI above MA and RSI above level 50 is a signal of a bullish trend. RSI below MA and RSI below level 50 is a signal of a bearish trend.
One can also buy when the RSI breaks level 20 from below and sell when RSI breaks level 80 from above
Tip 1: Look out for bounces. When RSI line bounces off from MA line it means the trend will likely continue;
Tip 2: Look out for support / resistance of RSI LINE.
Tip 3: USE as follow = higher timeframe to lower timeframe
보호된 스크립트입니다
이 스크립트는 비공개 소스로 게시됩니다. 하지만 제한 없이 자유롭게 사용할 수 있습니다 — 여기에서 자세히 알아보기.
면책사항
이 정보와 게시물은 TradingView에서 제공하거나 보증하는 금융, 투자, 거래 또는 기타 유형의 조언이나 권고 사항을 의미하거나 구성하지 않습니다. 자세한 내용은 이용 약관을 참고하세요.
면책사항
이 정보와 게시물은 TradingView에서 제공하거나 보증하는 금융, 투자, 거래 또는 기타 유형의 조언이나 권고 사항을 의미하거나 구성하지 않습니다. 자세한 내용은 이용 약관을 참고하세요.