OPEN-SOURCE SCRIPT
CarrerasTrend
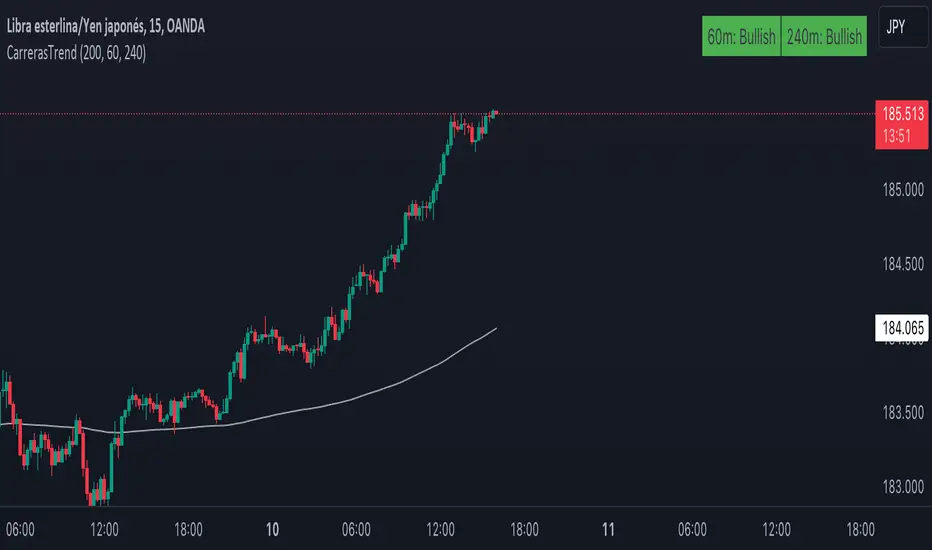
This indicator, created by Maximiliano Carreras, displays the trend based on the 200-period EMA (Adjustable) on the chart. The EMA is calculated based on data from the 1-hour and 4-hour charts (Both adjustable timeframes). The indicator labels the trend as "Bullish" if the closing price is above the EMA and as "Bearish" if it is below. The indicator is shown in the top right corner of the chart, providing information about the overall trend of the underlying asset.
You can also choose whether to display the EMA on the chart or not, as well as select between 1 or 2 timeframes for display.
Feel free to leave a comment if you liked it!
Ahora en Español:
Este indicador, creado por Maximiliano Carreras, muestra la tendencia basada en la EMA de 200 periodos (Modificable) en el gráfico. La EMA es calculada en función de los datos del gráfico de 1 y 4 horas (Modificables ambos tiempos). El indicador etiqueta la tendencia como "Bullish" (alcista) si el precio de cierre está por encima de la EMA y como "Bearish" (bajista) si está por debajo. El indicador se muestra en la esquina superior derecha del gráfico, proporcionando información sobre la tendencia general del activo subyacente.
También se puede mostrar o no la ema en el gráfico, al igual si elegir 1 o 2 tiempos para mostrar
Dejame un comentario si te gustó
오픈 소스 스크립트
트레이딩뷰의 진정한 정신에 따라, 이 스크립트의 작성자는 이를 오픈소스로 공개하여 트레이더들이 기능을 검토하고 검증할 수 있도록 했습니다. 작성자에게 찬사를 보냅니다! 이 코드는 무료로 사용할 수 있지만, 코드를 재게시하는 경우 하우스 룰이 적용된다는 점을 기억하세요.
면책사항
해당 정보와 게시물은 금융, 투자, 트레이딩 또는 기타 유형의 조언이나 권장 사항으로 간주되지 않으며, 트레이딩뷰에서 제공하거나 보증하는 것이 아닙니다. 자세한 내용은 이용 약관을 참조하세요.
오픈 소스 스크립트
트레이딩뷰의 진정한 정신에 따라, 이 스크립트의 작성자는 이를 오픈소스로 공개하여 트레이더들이 기능을 검토하고 검증할 수 있도록 했습니다. 작성자에게 찬사를 보냅니다! 이 코드는 무료로 사용할 수 있지만, 코드를 재게시하는 경우 하우스 룰이 적용된다는 점을 기억하세요.
면책사항
해당 정보와 게시물은 금융, 투자, 트레이딩 또는 기타 유형의 조언이나 권장 사항으로 간주되지 않으며, 트레이딩뷰에서 제공하거나 보증하는 것이 아닙니다. 자세한 내용은 이용 약관을 참조하세요.