OPEN-SOURCE SCRIPT
Linear Regress on Price And Volume
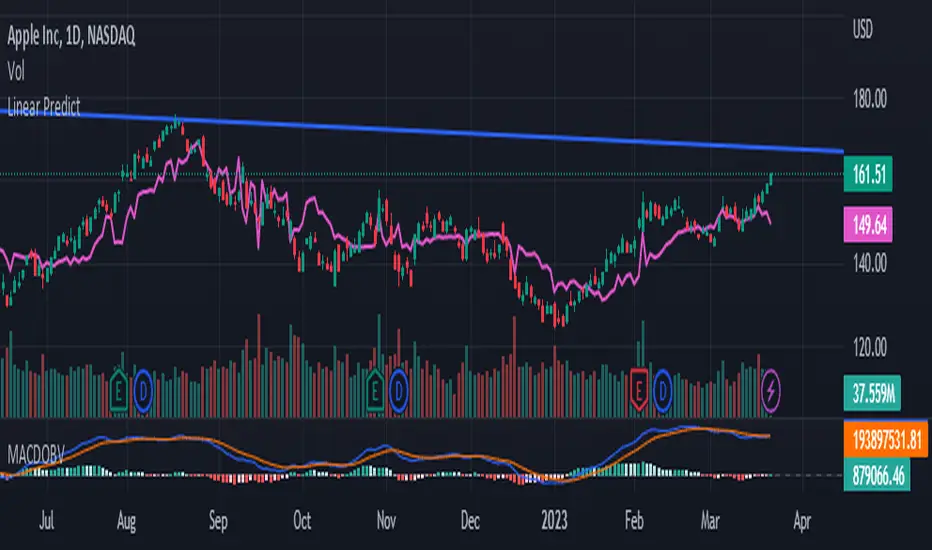
Linear regression is a statistical method used to model the relationship between a dependent variable and one or more independent variables. It assumes a linear relationship between the dependent variable and the independent variable(s) and attempts to fit a straight line that best describes the relationship.
In the context of predicting the price of a stock based on the volume, we can use linear regression to build a model that relates the price of the stock (dependent variable) to the volume (independent variable). The idea is to use lookback period to predict future prices based on the volume.
To build this indicator, we start by collecting data on the price of the stock and the volume over a selected of time or by default 21 days. We then plot the data on a scatter plot with the volume on the x-axis and the price on the y-axis. If there is a clear pattern in the data, we can fit a straight line to the data using a method called least squares regression. The line represents the best linear approximation of the relationship between the price and the volume.
Once we have the line, we can use it to make predictions. For example, if we observe a certain volume, we can use the line to estimate the corresponding price.
It's worth noting that linear regression assumes a linear relationship between the variables. In reality, the relationship between the price and the volume may be more complex, and other factors may also influence the price of the stock. Therefore, while linear regression can be a useful tool, it should be used in conjunction with other methods and should be interpreted with caution.
오픈 소스 스크립트
트레이딩뷰의 진정한 정신에 따라, 이 스크립트의 작성자는 이를 오픈소스로 공개하여 트레이더들이 기능을 검토하고 검증할 수 있도록 했습니다. 작성자에게 찬사를 보냅니다! 이 코드는 무료로 사용할 수 있지만, 코드를 재게시하는 경우 하우스 룰이 적용된다는 점을 기억하세요.
면책사항
해당 정보와 게시물은 금융, 투자, 트레이딩 또는 기타 유형의 조언이나 권장 사항으로 간주되지 않으며, 트레이딩뷰에서 제공하거나 보증하는 것이 아닙니다. 자세한 내용은 이용 약관을 참조하세요.
오픈 소스 스크립트
트레이딩뷰의 진정한 정신에 따라, 이 스크립트의 작성자는 이를 오픈소스로 공개하여 트레이더들이 기능을 검토하고 검증할 수 있도록 했습니다. 작성자에게 찬사를 보냅니다! 이 코드는 무료로 사용할 수 있지만, 코드를 재게시하는 경우 하우스 룰이 적용된다는 점을 기억하세요.
면책사항
해당 정보와 게시물은 금융, 투자, 트레이딩 또는 기타 유형의 조언이나 권장 사항으로 간주되지 않으며, 트레이딩뷰에서 제공하거나 보증하는 것이 아닙니다. 자세한 내용은 이용 약관을 참조하세요.