PROTECTED SOURCE SCRIPT
Nearest Ichimoku Levels (Multi-Timeframe)
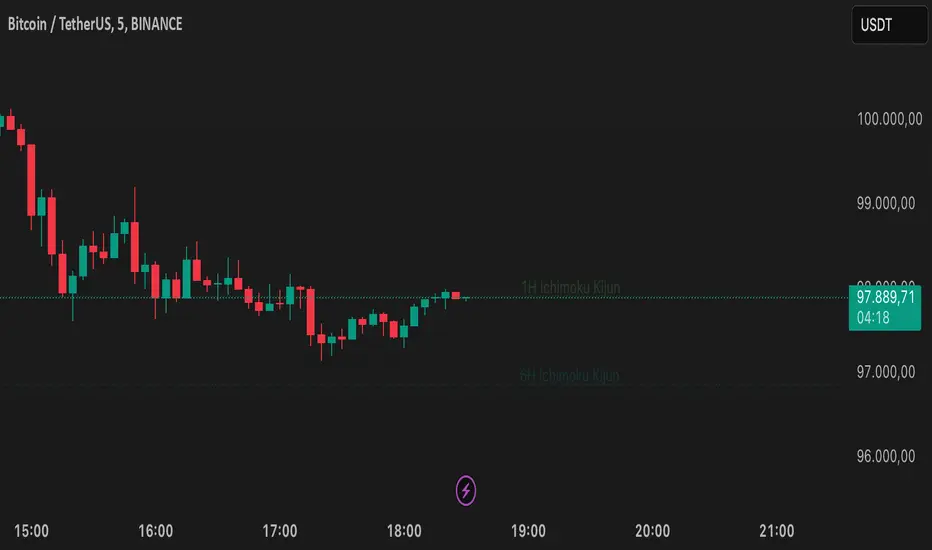
This indicator dynamically calculates the nearest Ichimoku levels (Tenkan-sen & Kijun-sen) across multiple timeframes. It helps traders identify trend direction, dynamic support/resistance levels, and key reversal zones.
📌 Key Features:
✔ Multi-Timeframe Support: Works across 1min to 1M (monthly) timeframes.
✔ Dynamic Ichimoku Levels: Calculates Tenkan-sen (Conversion Line) and Kijun-sen (Base Line) in real-time.
✔ Customizable Ichimoku Settings: Adjustable Tenkan-sen & Kijun-sen periods.
✔ Auto Detection: Finds and plots the nearest Ichimoku levels above and below the price.
✔ Customizable Display: Adjustable line style, thickness, and colors for clarity.
✔ Clear Labels: Displays timeframe and Ichimoku level directly on the chart.
🛠 How to Use:
Enable preferred timeframes and set Ichimoku parameters.
The script will plot the closest Tenkan-sen and Kijun-sen levels automatically.
Labels show the timeframe and Ichimoku level for better clarity.
⚠ Note:
For technical analysis only, not financial advice.
Too many enabled timeframes may clutter the chart—enable only needed ones.
🚀 Perfect for:
✔ Identifying Trend Direction
✔ Tracking Ichimoku Support & Resistance Levels
✔ Analyzing Market Conditions Across Timeframes
보호된 스크립트입니다
이 스크립트는 비공개 소스로 게시됩니다. 하지만 이를 자유롭게 제한 없이 사용할 수 있습니다 – 자세한 내용은 여기에서 확인하세요.
면책사항
해당 정보와 게시물은 금융, 투자, 트레이딩 또는 기타 유형의 조언이나 권장 사항으로 간주되지 않으며, 트레이딩뷰에서 제공하거나 보증하는 것이 아닙니다. 자세한 내용은 이용 약관을 참조하세요.
보호된 스크립트입니다
이 스크립트는 비공개 소스로 게시됩니다. 하지만 이를 자유롭게 제한 없이 사용할 수 있습니다 – 자세한 내용은 여기에서 확인하세요.
면책사항
해당 정보와 게시물은 금융, 투자, 트레이딩 또는 기타 유형의 조언이나 권장 사항으로 간주되지 않으며, 트레이딩뷰에서 제공하거나 보증하는 것이 아닙니다. 자세한 내용은 이용 약관을 참조하세요.