PROTECTED SOURCE SCRIPT
Price Range Deviation
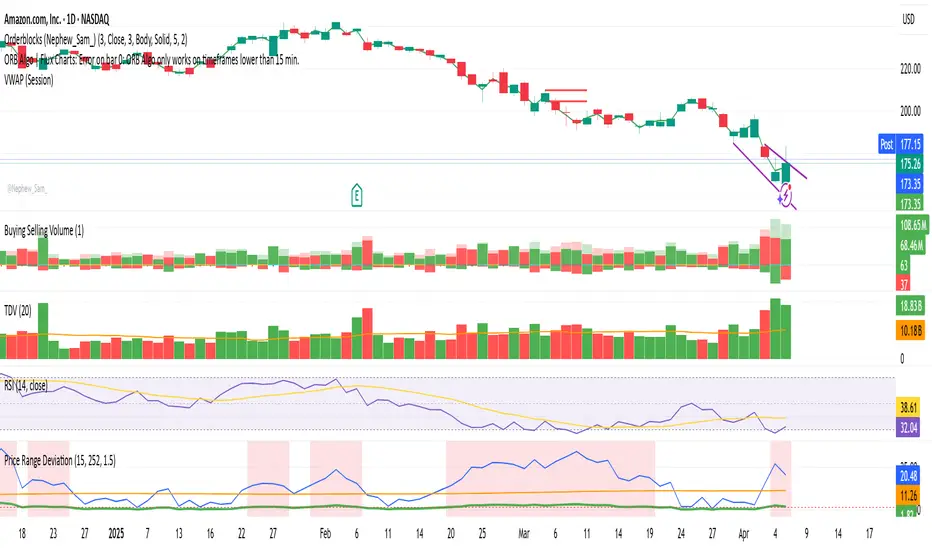
📌 Description: Price Range Deviation Indicator
This indicator measures how much a stock has moved over a recent period (e.g., 15 days) and compares that move to the average move of similar-length windows over a longer lookback period (e.g., 1 year or 252 days).
It helps identify when a stock has made an unusually large move compared to its historical norm — which can signal that the move is overextended.
📊 How It Works:
Recent Move ($): The absolute price change over the selected recent period.
Average Move ($): The average absolute price change over rolling windows of the same size across the full lookback period.
Move Ratio: The current move divided by the average move.
When the move ratio exceeds a custom threshold (e.g., 1.5× the average), the background highlights red to signal that the move is unusually large.
💡 Use Case:
Ideal for options traders looking to:
Identify overextended price moves
Sell out-of-the-money calls or puts beyond a high-move zone
Fade price exhaustion with high probability setups
보호된 스크립트입니다
이 스크립트는 비공개 소스로 게시됩니다. 하지만 이를 자유롭게 제한 없이 사용할 수 있습니다 – 자세한 내용은 여기에서 확인하세요.
면책사항
해당 정보와 게시물은 금융, 투자, 트레이딩 또는 기타 유형의 조언이나 권장 사항으로 간주되지 않으며, 트레이딩뷰에서 제공하거나 보증하는 것이 아닙니다. 자세한 내용은 이용 약관을 참조하세요.
보호된 스크립트입니다
이 스크립트는 비공개 소스로 게시됩니다. 하지만 이를 자유롭게 제한 없이 사용할 수 있습니다 – 자세한 내용은 여기에서 확인하세요.
면책사항
해당 정보와 게시물은 금융, 투자, 트레이딩 또는 기타 유형의 조언이나 권장 사항으로 간주되지 않으며, 트레이딩뷰에서 제공하거나 보증하는 것이 아닙니다. 자세한 내용은 이용 약관을 참조하세요.