PROTECTED SOURCE SCRIPT
WaveViewer
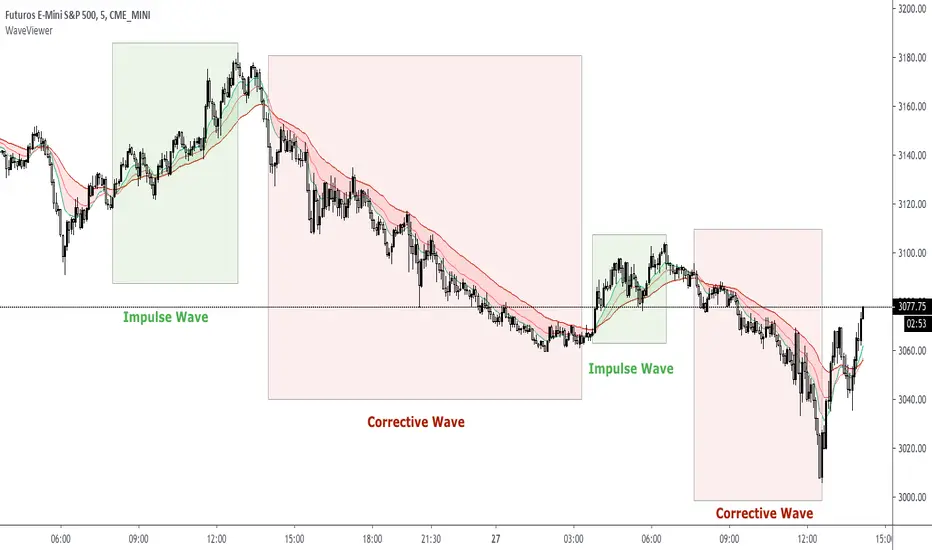
WaveViewer impulsive and corrective wave viewer indicator
The market is developed by making impulsive wave movements and corrective waves thus forming a "V" type fractal
This indicator allows you to easily visualize these movements to make buying or selling decisions
WaveViewer is an indicator that allows the identification of impulsive waves visually through EMAs crossings
Visually facilitates the green color for the impulsive wave and red for the corrective wave
NOTE 1: This indicator should be complemented with the 1-9 fractal counter
NOTE 2: WaveViewer recommended for instrument ES1 ( SP500 ) with timeframe 5 minutes
보호된 스크립트입니다
이 스크립트는 비공개 소스로 게시됩니다. 하지만 이를 자유롭게 제한 없이 사용할 수 있습니다 – 자세한 내용은 여기에서 확인하세요.
면책사항
해당 정보와 게시물은 금융, 투자, 트레이딩 또는 기타 유형의 조언이나 권장 사항으로 간주되지 않으며, 트레이딩뷰에서 제공하거나 보증하는 것이 아닙니다. 자세한 내용은 이용 약관을 참조하세요.
보호된 스크립트입니다
이 스크립트는 비공개 소스로 게시됩니다. 하지만 이를 자유롭게 제한 없이 사용할 수 있습니다 – 자세한 내용은 여기에서 확인하세요.
면책사항
해당 정보와 게시물은 금융, 투자, 트레이딩 또는 기타 유형의 조언이나 권장 사항으로 간주되지 않으며, 트레이딩뷰에서 제공하거나 보증하는 것이 아닙니다. 자세한 내용은 이용 약관을 참조하세요.