OPEN-SOURCE SCRIPT
Dynamic Price Impulse
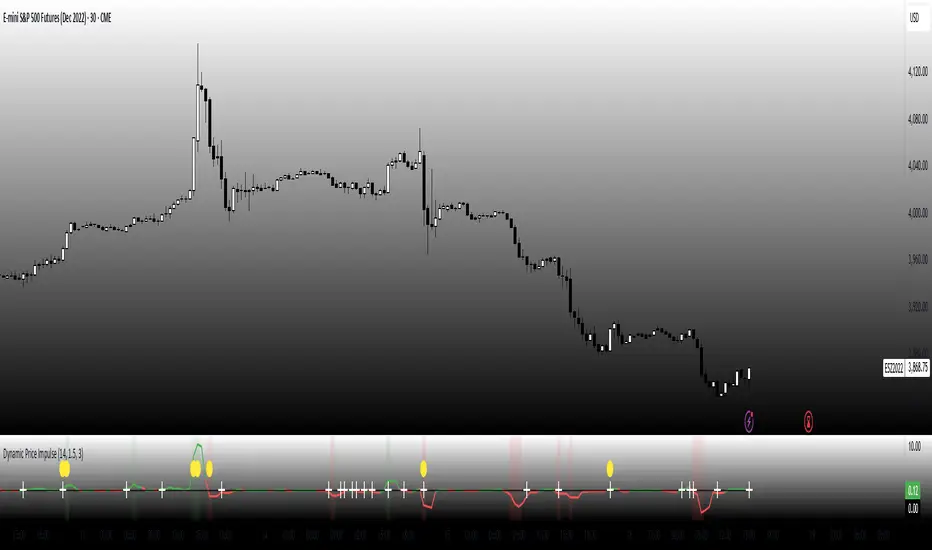
This indicator is designed to capture price momentum without the lag typically found in traditional oscillators.
Core Mechanics
Instead of using simple price differences, the indicator normalizes changes relative to the average true range (ATR), making it adaptive to different volatility regimes.
By squaring the normalized change while preserving its sign, the indicator responds more aggressively to stronger price moves while remaining sensitive to smaller ones.
The indicator identifies periods when volatility is expanding, which often precede significant price movements.
Trading Strategy Applications
1. Momentum Signals:
o When the indicator crosses above zero, look for long entries
o When it crosses below zero, look for short entries
o The stronger the impulse (farther from zero), the stronger the signal
2. Early Trend Detection:
o Volatility expansion markers (yellow circles) often appear at the beginning of new trends
o Use these as early warning signals to prepare for potential entries
3. Trend Continuation:
o Strong readings in the direction of the trend suggest continuation
o Weakening readings suggest the trend may be losing steam
4. Counter-Trend Opportunities:
o Look for divergences between price and the indicator for potential reversals
o When price makes a new high but the indicator doesn't, consider potential shorts (and vice versa)
Fine-Tuning
• Length (14): Controls the lookback period for ATR calculation. Lower values make it more responsive but noisier.
• Threshold (1.5): Determines how much volatility needs to expand to trigger the volatility expansion signal.
• Smoothing (3): Reduces noise in the signal. Higher values reduce false signals but introduce more lag.
오픈 소스 스크립트
트레이딩뷰의 진정한 정신에 따라, 이 스크립트의 작성자는 이를 오픈소스로 공개하여 트레이더들이 기능을 검토하고 검증할 수 있도록 했습니다. 작성자에게 찬사를 보냅니다! 이 코드는 무료로 사용할 수 있지만, 코드를 재게시하는 경우 하우스 룰이 적용된다는 점을 기억하세요.
면책사항
해당 정보와 게시물은 금융, 투자, 트레이딩 또는 기타 유형의 조언이나 권장 사항으로 간주되지 않으며, 트레이딩뷰에서 제공하거나 보증하는 것이 아닙니다. 자세한 내용은 이용 약관을 참조하세요.
오픈 소스 스크립트
트레이딩뷰의 진정한 정신에 따라, 이 스크립트의 작성자는 이를 오픈소스로 공개하여 트레이더들이 기능을 검토하고 검증할 수 있도록 했습니다. 작성자에게 찬사를 보냅니다! 이 코드는 무료로 사용할 수 있지만, 코드를 재게시하는 경우 하우스 룰이 적용된다는 점을 기억하세요.
면책사항
해당 정보와 게시물은 금융, 투자, 트레이딩 또는 기타 유형의 조언이나 권장 사항으로 간주되지 않으며, 트레이딩뷰에서 제공하거나 보증하는 것이 아닙니다. 자세한 내용은 이용 약관을 참조하세요.