OPEN-SOURCE SCRIPT
Trend Following ADX + Parabolic SAR
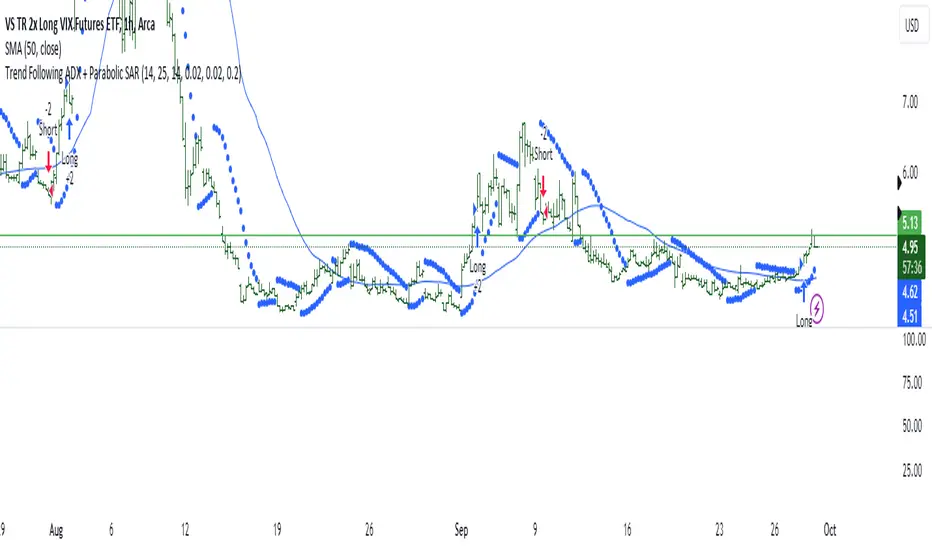
### Strategy Description: Trend Following using **ADX** and **Parabolic SAR**
This strategy is designed to follow market trends using two popular indicators: **Average Directional Index (ADX)** and **Parabolic SAR**. The strategy attempts to enter trades when the market shows a strong trend (using ADX) and confirms the trend direction using the Parabolic SAR. Here's a breakdown:
### Key Indicators:
1. **ADX (Average Directional Index)**:
- **Purpose**: ADX measures the strength of a trend, regardless of direction.
- **Usage**: The strategy uses ADX to confirm that the market is trending. When ADX is above a certain threshold (e.g., 25), it indicates a strong trend.
- **Directional Indicators**:
- **DI+ (Directional Indicator Plus)**: Indicates upward movement strength.
- **DI- (Directional Indicator Minus)**: Indicates downward movement strength.
2. **Parabolic SAR**:
- **Purpose**: Parabolic SAR is a trend-following indicator used to identify potential reversals in the price direction.
- **Usage**: It provides specific price points above or below which the strategy confirms buy or sell signals.
### Strategy Logic:
#### **Entry Conditions**:
1. **Long Position** (Buy):
- **ADX** is above the threshold (default: 25), indicating a strong trend.
- **DI+ > DI-**, indicating the upward trend is stronger than the downward.
- The price is above the **Parabolic SAR** level, confirming the upward trend.
2. **Short Position** (Sell):
- **ADX** is above the threshold (default: 25), indicating a strong trend.
- **DI- > DI+**, indicating the downward trend is stronger than the upward.
- The price is below the **Parabolic SAR** level, confirming the downward trend.
#### **Exit Conditions**:
- Positions are closed when an opposite signal is detected.
- For example, if a long position is open and the conditions for a short position are met, the long position is closed, and a short position is opened.
### Parameters:
1. **ADX Period**: Defines the length of the period for the ADX calculation (default: 14).
2. **ADX Threshold**: The minimum value of ADX to confirm a strong trend (default: 25).
3. **Parabolic SAR Start**: The initial step for the SAR (default: 0.02).
4. **Parabolic SAR Increment**: The step increment for SAR (default: 0.02).
5. **Parabolic SAR Max**: The maximum step for SAR (default: 0.2).
### Example Trade Flow:
#### **Long Trade**:
1. ADX > 25, confirming a strong trend.
2. DI+ > DI-, indicating the market is trending upward.
3. The price is above the Parabolic SAR, confirming the upward direction.
4. **Action**: Enter a long (buy) position.
5. Exit the long position when a short signal is triggered (i.e., DI- > DI+, price below Parabolic SAR).
#### **Short Trade**:
1. ADX > 25, confirming a strong trend.
2. DI- > DI+, indicating the market is trending downward.
3. The price is below the Parabolic SAR, confirming the downward direction.
4. **Action**: Enter a short (sell) position.
5. Exit the short position when a long signal is triggered (i.e., DI+ > DI-, price above Parabolic SAR).
### Strengths of the Strategy:
- **Trend-Following**: It performs well in markets with strong trends, whether upward or downward.
- **Dual Confirmation**: The combination of ADX and Parabolic SAR reduces false signals by ensuring both trend strength and direction are considered before entering a trade.
### Weaknesses:
- **Range-Bound Markets**: This strategy may perform poorly in choppy, non-trending markets because both ADX and SAR are trend-following indicators.
- **Lagging Nature**: Since both ADX and SAR are lagging indicators, the strategy may enter trades after the trend has already started, potentially missing early profits.
### Customization:
- **ADX Threshold**: You can increase the threshold if you only want to trade in very strong trends, or lower it to capture more moderate trends.
- **SAR Parameters**: Adjusting the SAR `start`, `increment`, and `max` values will make the Parabolic SAR more or less sensitive to price changes.
### Summary:
This strategy combines the ADX and Parabolic SAR to take advantage of strong market trends. By confirming both trend strength (ADX) and trend direction (Parabolic SAR), it aims to enter high-probability trades in trending markets while minimizing false signals. However, it may struggle in sideways or non-trending markets.
For Educational purposes only !!!
오픈 소스 스크립트
트레이딩뷰의 진정한 정신에 따라, 이 스크립트의 작성자는 이를 오픈소스로 공개하여 트레이더들이 기능을 검토하고 검증할 수 있도록 했습니다. 작성자에게 찬사를 보냅니다! 이 코드는 무료로 사용할 수 있지만, 코드를 재게시하는 경우 하우스 룰이 적용된다는 점을 기억하세요.
면책사항
해당 정보와 게시물은 금융, 투자, 트레이딩 또는 기타 유형의 조언이나 권장 사항으로 간주되지 않으며, 트레이딩뷰에서 제공하거나 보증하는 것이 아닙니다. 자세한 내용은 이용 약관을 참조하세요.
오픈 소스 스크립트
트레이딩뷰의 진정한 정신에 따라, 이 스크립트의 작성자는 이를 오픈소스로 공개하여 트레이더들이 기능을 검토하고 검증할 수 있도록 했습니다. 작성자에게 찬사를 보냅니다! 이 코드는 무료로 사용할 수 있지만, 코드를 재게시하는 경우 하우스 룰이 적용된다는 점을 기억하세요.
면책사항
해당 정보와 게시물은 금융, 투자, 트레이딩 또는 기타 유형의 조언이나 권장 사항으로 간주되지 않으며, 트레이딩뷰에서 제공하거나 보증하는 것이 아닙니다. 자세한 내용은 이용 약관을 참조하세요.