OPEN-SOURCE SCRIPT
업데이트됨 Bollinger Band Volatility Spread Visualizer
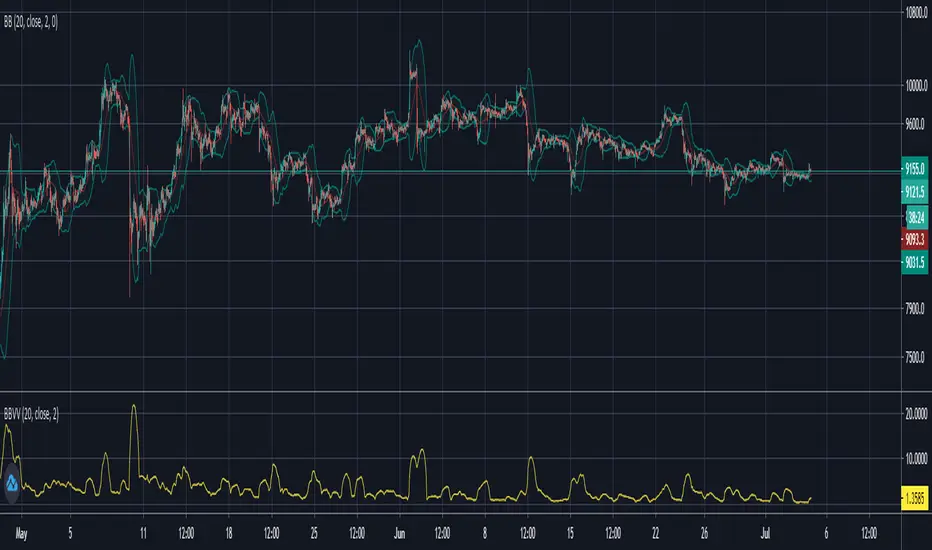
This indicator was created to see the total dollar (or whatever currency pair) amount spread between the upper and lower Bollinger Bands. This knowledge of knowing this spread can be used to indicate upcoming periods of high volatility in a market. The fundamental idea behind predicting periods of high volatility is backed up by the idea that periods of low volatility are followed by periods of high volatility and vice versa.
Based on this knowledge, the numerical spread of the Bollinger Bands, as shown in the indicator, we can deduce that when the value is super low, we can expect a period of high volatility AKA: big move incoming.
This indicator is not fully finished because this was my first time coding in Pinescript and I wanted to post the basic indicator first.
My future plans for improving this indicator include:
- Adding customization as an option to choose your personal BBands settings that this indicator is based off of
- Potentially converting this indicator as a TradingView Strategy where a signal would go off when the spread reaches a certain threshold
릴리즈 노트
Added code for custom Bollinger Bands input for flexibility for everyone's different uses of Bollinger Bands릴리즈 노트
Changed the way the data is presented by indexing the spread of the Bollinger Bands relative to the price of the asset. Basically just used the Bollinger Bands Width function that already exists and multiplied by 100 to get more precision. My eventual goal is to figure out a threshold that when reached, creates a general signal of upcoming high volatility. That signal can then be used in conjunction with other indicators (to detect the direction of a trend) to create a buy or sell signal.
오픈 소스 스크립트
트레이딩뷰의 진정한 정신에 따라, 이 스크립트의 작성자는 이를 오픈소스로 공개하여 트레이더들이 기능을 검토하고 검증할 수 있도록 했습니다. 작성자에게 찬사를 보냅니다! 이 코드는 무료로 사용할 수 있지만, 코드를 재게시하는 경우 하우스 룰이 적용된다는 점을 기억하세요.
면책사항
해당 정보와 게시물은 금융, 투자, 트레이딩 또는 기타 유형의 조언이나 권장 사항으로 간주되지 않으며, 트레이딩뷰에서 제공하거나 보증하는 것이 아닙니다. 자세한 내용은 이용 약관을 참조하세요.
오픈 소스 스크립트
트레이딩뷰의 진정한 정신에 따라, 이 스크립트의 작성자는 이를 오픈소스로 공개하여 트레이더들이 기능을 검토하고 검증할 수 있도록 했습니다. 작성자에게 찬사를 보냅니다! 이 코드는 무료로 사용할 수 있지만, 코드를 재게시하는 경우 하우스 룰이 적용된다는 점을 기억하세요.
면책사항
해당 정보와 게시물은 금융, 투자, 트레이딩 또는 기타 유형의 조언이나 권장 사항으로 간주되지 않으며, 트레이딩뷰에서 제공하거나 보증하는 것이 아닙니다. 자세한 내용은 이용 약관을 참조하세요.