OPEN-SOURCE SCRIPT
Institutional Activity Detector
Institutional Activity Detector - Complete Tutorial
Table of Contents
Installation
Understanding the Indicator
Signal Interpretation
Settings Configuration
Trading Strategies
Best Practices
Common Mistakes to Avoid
1. Installation {#installation}
Step-by-Step Setup:
Step 1: Access TradingView
Go to TradingView.com
Log in to your account (free account works fine)
Step 2: Open Pine Editor
Click on "Pine Editor" at the bottom of the chart
If you don't see it, go to the top menu and select "Pine Editor"
Step 3: Add the Script
Click "New" to create a new indicator
Delete any default code
Copy the entire Institutional Activity Detector code
Paste it into the editor
Step 4: Save and Apply
Click "Save" (give it a name like "Inst Detector")
Click "Add to Chart"
The indicator will now appear on your chart
2. Understanding the Indicator {#understanding}
What It Detects:
This indicator identifies institutional traders (banks, hedge funds, market makers) by analyzing:
Volume Analysis
Detects unusual volume spikes that indicate large players entering
Compares current volume to 20-period average
Institutional trades create volume 2-5x normal levels
Order Flow
Delta: Difference between buying and selling volume
Positive delta = More buying pressure
Negative delta = More selling pressure
Institutions leave "footprints" in order flow
Price Action Patterns
Bullish Rejection Wicks:
| <- Small upper wick
|
███ <- Small body
███
|
|
| <- Large lower wick (rejection)
Indicates institutions bought aggressively at lower prices
Bearish Rejection Wicks:
|
|
| <- Large upper wick (rejection)
|
███ <- Small body
███
| <- Small lower wick
Indicates institutions sold aggressively at higher prices
Liquidity Grabs
Institutions often:
Push price above resistance or below support
Trigger stop losses (grab liquidity)
Reverse direction and trade the other way
Dark Pool Activity
Large block trades executed off-exchange:
High volume with minimal price movement
Indicates institutional accumulation/distribution without moving price
3. Signal Interpretation {#signals}
Signal Types:
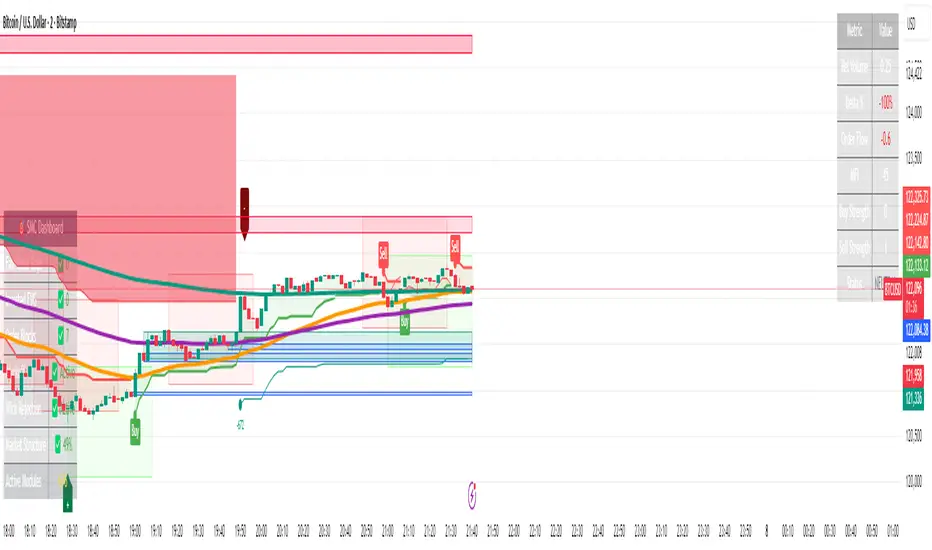
🟢 INSTITUTIONAL BUY Signal
Appears as green triangle below candle with strength number (2-5)
What it means:
Institutions are actively accumulating (buying)
Higher strength = More confirmation factors
Strength Levels:
2-3: Moderate confidence - Wait for confirmation
4: High confidence - Strong institutional interest
5: Maximum confidence - Multiple factors aligned
🔴 INSTITUTIONAL SELL Signal
Appears as red triangle above candle with strength number (2-5)
What it means:
Institutions are actively distributing (selling)
Higher strength = More confirmation factors
🟠 Dark Pool (DP) Marker
Small orange diamond
What it means:
Large block trade executed
Accumulation/distribution happening quietly
Often precedes significant moves
Liquidity Zones
Red boxes above price = Resistance/sell liquidity
Green boxes below price = Support/buy liquidity
Institutions target these zones to trigger stops
4. Settings Configuration {#settings}
Recommended Settings by Asset Type:
For Stocks (SPY, AAPL, TSLA):
Volume Spike Multiplier: 2.0
Volume Average Period: 20
Delta Threshold: 70%
Minimum Signal Strength: 3
Timeframe: 5m, 15m, 1H
For Forex (EUR/USD, GBP/USD):
Volume Spike Multiplier: 1.5
Volume Average Period: 30
Delta Threshold: 65%
Minimum Signal Strength: 3
Timeframe: 15m, 1H, 4H
For Crypto (BTC, ETH):
Volume Spike Multiplier: 2.5
Volume Average Period: 20
Delta Threshold: 70%
Minimum Signal Strength: 4
Timeframe: 15m, 1H, 4H
For Futures (ES, NQ):
Volume Spike Multiplier: 2.0
Volume Average Period: 20
Delta Threshold: 75%
Minimum Signal Strength: 3
Timeframe: 5m, 15m, 30m
Parameter Explanations:
Volume Spike Multiplier (1.0 - 10.0)
Lower = More sensitive (more signals, some false)
Higher = Less sensitive (fewer signals, more reliable)
Start with 2.0 and adjust based on your asset's volatility
Delta Threshold % (50 - 100)
Measures buying vs selling pressure
70% = Strong institutional bias required
Lower for ranging markets, higher for trending
Minimum Signal Strength (2 - 5)
Number of factors that must align for a signal
2 = Very sensitive (many signals)
5 = Very conservative (rare signals)
Recommended: 3-4 for balance
5. Trading Strategies {#strategies}
Strategy 1: Liquidity Grab Reversal
Setup:
Price approaches a liquidity zone (green/red box)
Price penetrates the zone briefly
Institutional BUY/SELL signal appears
Price reverses away from the zone
Entry:
Enter on the signal candle close
Or wait for next candle confirmation
Stop Loss:
Below the liquidity grab low (for buys)
Above the liquidity grab high (for sells)
Take Profit:
2:1 or 3:1 risk/reward ratio
Or next opposing liquidity zone
Example:
Price drops below support → Triggers stops →
Institutional BUY signal (4-5 strength) →
Enter LONG → Price rallies
Strategy 2: Trend Continuation
Setup:
Identify the trend (higher highs/higher lows for uptrend)
Wait for pullback to support in uptrend
Institutional BUY signal appears during pullback
Confirms institutions are adding to positions
Entry:
Enter on signal with strength ≥ 4
Or next candle after signal
Stop Loss:
Below the pullback low + small buffer
Take Profit:
Previous swing high
Or trailing stop using ATR
Strategy 3: Dark Pool Accumulation
Setup:
Dark Pool (DP) markers appear multiple times
Price consolidates in tight range
Institutional BUY signal with high strength appears
Breakout occurs
Entry:
Enter on breakout candle after signal
Or on retest of breakout level
Stop Loss:
Below consolidation range
Take Profit:
Measured move (height of consolidation projected)
Strategy 4: Divergence Play
Setup:
Price makes lower low
MFI/RSI makes higher low (bullish divergence)
Institutional BUY signal appears
Volume confirms with spike
Entry:
Enter on signal candle or next
Stop Loss:
Below the divergence low
Take Profit:
Previous swing high or resistance
6. Best Practices {#best-practices}
✅ DO's:
1. Use Multiple Timeframes
Check higher timeframe for trend direction
Trade signals that align with higher timeframe
Example: 15m signals in direction of 1H trend
2. Combine with Key Levels
Support/resistance
Supply/demand zones
Previous day high/low
Round numbers (psychological levels)
3. Wait for Confirmation
Don't rush into trades
Let the signal candle close
Watch next candle for follow-through
4. Check the Metrics Table
Look at Relative Volume (should be >2.0)
Check Delta % (should be strong positive/negative)
Verify Order Flow aligns with signal
5. Consider Market Context
News events can override signals
Low liquidity times (lunch, overnight) less reliable
Major economic releases need caution
6. Paper Trade First
Test the indicator for 2-4 weeks
Learn how it behaves on your chosen assets
Develop confidence before using real money
Best Times to Trade:
Stock Market Hours:
9:30-11:30 AM EST (high volume, strong moves)
2:00-4:00 PM EST (institutional positioning)
Avoid: 11:30 AM-2:00 PM (lunch, low volume)
Forex:
London Open: 3:00-6:00 AM EST
New York Open: 8:00-11:00 AM EST
London/NY Overlap: 8:00 AM-12:00 PM EST
Crypto:
24/7 market, but highest volume during US/European hours
Watch for weekend low liquidity
7. Common Mistakes to Avoid {#mistakes}
❌ DON'T:
1. Trade Every Signal
Not all signals are equal
Focus on strength 4-5 signals
Wait for optimal setups
2. Ignore Market Structure
Don't buy into strong downtrends (catch falling knife)
Don't sell into strong uptrends (fight the tape)
Respect major support/resistance
3. Use Too Small Timeframes
1m and 2m charts are too noisy
Minimum recommended: 5m for scalping
Better: 15m, 30m, 1H for reliability
4. Overtrade
Quality over quantity
2-5 good trades per day is excellent
Forcing trades leads to losses
5. Ignore Risk Management
Always use stop losses
Risk only 1-2% per trade
Don't revenge trade after losses
6. Trade During Low Volume
Signals less reliable with low volume
Check Relative Volume metric (should be >1.5)
Avoid pre-market/after-hours for stocks
7. Misread Liquidity Grabs
Not every wick is a liquidity grab
Need volume confirmation
Must have institutional signal
Advanced Tips:
Filtering False Signals:
Use Signal Strength Filter:
Minimum strength 3 = Balanced
Minimum strength 4 = Conservative (recommended)
Minimum strength 5 = Ultra conservative
Confluence Checklist:
Signal strength ≥ 4
Relative volume > 2.0
At key support/resistance
Aligns with higher timeframe trend
Delta % strongly positive/negative
Clean price action setup
If 4+ boxes checked = High probability trade
Setting Up Alerts:
Click the three dots on the indicator
Select "Create Alert"
Choose condition:
"Institutional Buy Signal"
"Institutional Sell Signal"
"Dark Pool Activity"
Set up notification (email, SMS, app)
Save alert
Alert Strategy:
Set minimum strength to 4 for fewer, better alerts
Use for assets you can't watch constantly
Don't rely solely on alerts - check chart context
Practice Exercise:
Week 1-2: Observation
Add indicator to your favorite assets
Watch how signals develop
Note which ones lead to profitable moves
Don't trade yet - just observe
Week 3-4: Paper Trading
Use TradingView's paper trading
Trade only strength 4-5 signals
Record results in a journal
Note: entry, exit, profit/loss, what worked/didn't
Week 5+: Small Live Positions
Start with smallest position size
Trade only your best setups
Gradually increase size as you gain confidence
Keep detailed journal
Quick Reference Card:
Signal Quality Ranking:
🔥 Best Setups (Take These):
Strength 5 + Liquidity grab + Key level
Strength 4-5 + Volume >3.0 + Trend alignment
Dark Pool markers + Strength 4+ signal
✅ Good Setups:
Strength 4 at support/resistance
Strength 3-4 with strong delta
Liquidity grab + Strength 3+
⚠️ Caution (Wait for More):
Strength 2-3 in middle of nowhere
Against higher timeframe trend
Low volume (Rel Vol <1.5)
❌ Avoid:
Strength 2 only
During major news
Low liquidity hours
Against strong trend
Troubleshooting:
"Too many signals"
→ Increase Minimum Signal Strength to 4
→ Increase Volume Spike Multiplier to 2.5-3.0
"Too few signals"
→ Decrease Minimum Signal Strength to 2-3
→ Decrease Volume Spike Multiplier to 1.5
"Signals not working"
→ Check if you're trading during low volume hours
→ Verify you're using recommended timeframes
→ Make sure signals align with market structure
"Can't see liquidity zones"
→ Enable "Show Liquidity Zones" in settings
→ Adjust Swing Detection Length (try 7-15)
Resources for Further Learning:
Concepts to Study:
Order Flow Trading
Market Profile / Volume Profile
Smart Money Concepts (SMC)
Liquidity Sweeps and Stop Hunts
Institutional Order Flow
Wyckoff Method
Volume Spread Analysis (VSA)
Recommended Practice:
Study past signals on chart
Replay market using TradingView's bar replay feature
Join trading communities to share setups
Keep a detailed trading journal
Final Thoughts:
This indicator is a tool, not a crystal ball. It identifies high-probability setups where institutions are active, but still requires:
Proper risk management
Market context understanding
Patience and discipline
Continuous learning
Success Formula:
Right Tool + Proper Training + Risk Management + Discipline = Consistent Profits
Start slow, master the basics, and gradually increase complexity as you gain experience.
Good luck and trade smart! 📊📈
Table of Contents
Installation
Understanding the Indicator
Signal Interpretation
Settings Configuration
Trading Strategies
Best Practices
Common Mistakes to Avoid
1. Installation {#installation}
Step-by-Step Setup:
Step 1: Access TradingView
Go to TradingView.com
Log in to your account (free account works fine)
Step 2: Open Pine Editor
Click on "Pine Editor" at the bottom of the chart
If you don't see it, go to the top menu and select "Pine Editor"
Step 3: Add the Script
Click "New" to create a new indicator
Delete any default code
Copy the entire Institutional Activity Detector code
Paste it into the editor
Step 4: Save and Apply
Click "Save" (give it a name like "Inst Detector")
Click "Add to Chart"
The indicator will now appear on your chart
2. Understanding the Indicator {#understanding}
What It Detects:
This indicator identifies institutional traders (banks, hedge funds, market makers) by analyzing:
Volume Analysis
Detects unusual volume spikes that indicate large players entering
Compares current volume to 20-period average
Institutional trades create volume 2-5x normal levels
Order Flow
Delta: Difference between buying and selling volume
Positive delta = More buying pressure
Negative delta = More selling pressure
Institutions leave "footprints" in order flow
Price Action Patterns
Bullish Rejection Wicks:
| <- Small upper wick
|
███ <- Small body
███
|
|
| <- Large lower wick (rejection)
Indicates institutions bought aggressively at lower prices
Bearish Rejection Wicks:
|
|
| <- Large upper wick (rejection)
|
███ <- Small body
███
| <- Small lower wick
Indicates institutions sold aggressively at higher prices
Liquidity Grabs
Institutions often:
Push price above resistance or below support
Trigger stop losses (grab liquidity)
Reverse direction and trade the other way
Dark Pool Activity
Large block trades executed off-exchange:
High volume with minimal price movement
Indicates institutional accumulation/distribution without moving price
3. Signal Interpretation {#signals}
Signal Types:
🟢 INSTITUTIONAL BUY Signal
Appears as green triangle below candle with strength number (2-5)
What it means:
Institutions are actively accumulating (buying)
Higher strength = More confirmation factors
Strength Levels:
2-3: Moderate confidence - Wait for confirmation
4: High confidence - Strong institutional interest
5: Maximum confidence - Multiple factors aligned
🔴 INSTITUTIONAL SELL Signal
Appears as red triangle above candle with strength number (2-5)
What it means:
Institutions are actively distributing (selling)
Higher strength = More confirmation factors
🟠 Dark Pool (DP) Marker
Small orange diamond
What it means:
Large block trade executed
Accumulation/distribution happening quietly
Often precedes significant moves
Liquidity Zones
Red boxes above price = Resistance/sell liquidity
Green boxes below price = Support/buy liquidity
Institutions target these zones to trigger stops
4. Settings Configuration {#settings}
Recommended Settings by Asset Type:
For Stocks (SPY, AAPL, TSLA):
Volume Spike Multiplier: 2.0
Volume Average Period: 20
Delta Threshold: 70%
Minimum Signal Strength: 3
Timeframe: 5m, 15m, 1H
For Forex (EUR/USD, GBP/USD):
Volume Spike Multiplier: 1.5
Volume Average Period: 30
Delta Threshold: 65%
Minimum Signal Strength: 3
Timeframe: 15m, 1H, 4H
For Crypto (BTC, ETH):
Volume Spike Multiplier: 2.5
Volume Average Period: 20
Delta Threshold: 70%
Minimum Signal Strength: 4
Timeframe: 15m, 1H, 4H
For Futures (ES, NQ):
Volume Spike Multiplier: 2.0
Volume Average Period: 20
Delta Threshold: 75%
Minimum Signal Strength: 3
Timeframe: 5m, 15m, 30m
Parameter Explanations:
Volume Spike Multiplier (1.0 - 10.0)
Lower = More sensitive (more signals, some false)
Higher = Less sensitive (fewer signals, more reliable)
Start with 2.0 and adjust based on your asset's volatility
Delta Threshold % (50 - 100)
Measures buying vs selling pressure
70% = Strong institutional bias required
Lower for ranging markets, higher for trending
Minimum Signal Strength (2 - 5)
Number of factors that must align for a signal
2 = Very sensitive (many signals)
5 = Very conservative (rare signals)
Recommended: 3-4 for balance
5. Trading Strategies {#strategies}
Strategy 1: Liquidity Grab Reversal
Setup:
Price approaches a liquidity zone (green/red box)
Price penetrates the zone briefly
Institutional BUY/SELL signal appears
Price reverses away from the zone
Entry:
Enter on the signal candle close
Or wait for next candle confirmation
Stop Loss:
Below the liquidity grab low (for buys)
Above the liquidity grab high (for sells)
Take Profit:
2:1 or 3:1 risk/reward ratio
Or next opposing liquidity zone
Example:
Price drops below support → Triggers stops →
Institutional BUY signal (4-5 strength) →
Enter LONG → Price rallies
Strategy 2: Trend Continuation
Setup:
Identify the trend (higher highs/higher lows for uptrend)
Wait for pullback to support in uptrend
Institutional BUY signal appears during pullback
Confirms institutions are adding to positions
Entry:
Enter on signal with strength ≥ 4
Or next candle after signal
Stop Loss:
Below the pullback low + small buffer
Take Profit:
Previous swing high
Or trailing stop using ATR
Strategy 3: Dark Pool Accumulation
Setup:
Dark Pool (DP) markers appear multiple times
Price consolidates in tight range
Institutional BUY signal with high strength appears
Breakout occurs
Entry:
Enter on breakout candle after signal
Or on retest of breakout level
Stop Loss:
Below consolidation range
Take Profit:
Measured move (height of consolidation projected)
Strategy 4: Divergence Play
Setup:
Price makes lower low
MFI/RSI makes higher low (bullish divergence)
Institutional BUY signal appears
Volume confirms with spike
Entry:
Enter on signal candle or next
Stop Loss:
Below the divergence low
Take Profit:
Previous swing high or resistance
6. Best Practices {#best-practices}
✅ DO's:
1. Use Multiple Timeframes
Check higher timeframe for trend direction
Trade signals that align with higher timeframe
Example: 15m signals in direction of 1H trend
2. Combine with Key Levels
Support/resistance
Supply/demand zones
Previous day high/low
Round numbers (psychological levels)
3. Wait for Confirmation
Don't rush into trades
Let the signal candle close
Watch next candle for follow-through
4. Check the Metrics Table
Look at Relative Volume (should be >2.0)
Check Delta % (should be strong positive/negative)
Verify Order Flow aligns with signal
5. Consider Market Context
News events can override signals
Low liquidity times (lunch, overnight) less reliable
Major economic releases need caution
6. Paper Trade First
Test the indicator for 2-4 weeks
Learn how it behaves on your chosen assets
Develop confidence before using real money
Best Times to Trade:
Stock Market Hours:
9:30-11:30 AM EST (high volume, strong moves)
2:00-4:00 PM EST (institutional positioning)
Avoid: 11:30 AM-2:00 PM (lunch, low volume)
Forex:
London Open: 3:00-6:00 AM EST
New York Open: 8:00-11:00 AM EST
London/NY Overlap: 8:00 AM-12:00 PM EST
Crypto:
24/7 market, but highest volume during US/European hours
Watch for weekend low liquidity
7. Common Mistakes to Avoid {#mistakes}
❌ DON'T:
1. Trade Every Signal
Not all signals are equal
Focus on strength 4-5 signals
Wait for optimal setups
2. Ignore Market Structure
Don't buy into strong downtrends (catch falling knife)
Don't sell into strong uptrends (fight the tape)
Respect major support/resistance
3. Use Too Small Timeframes
1m and 2m charts are too noisy
Minimum recommended: 5m for scalping
Better: 15m, 30m, 1H for reliability
4. Overtrade
Quality over quantity
2-5 good trades per day is excellent
Forcing trades leads to losses
5. Ignore Risk Management
Always use stop losses
Risk only 1-2% per trade
Don't revenge trade after losses
6. Trade During Low Volume
Signals less reliable with low volume
Check Relative Volume metric (should be >1.5)
Avoid pre-market/after-hours for stocks
7. Misread Liquidity Grabs
Not every wick is a liquidity grab
Need volume confirmation
Must have institutional signal
Advanced Tips:
Filtering False Signals:
Use Signal Strength Filter:
Minimum strength 3 = Balanced
Minimum strength 4 = Conservative (recommended)
Minimum strength 5 = Ultra conservative
Confluence Checklist:
Signal strength ≥ 4
Relative volume > 2.0
At key support/resistance
Aligns with higher timeframe trend
Delta % strongly positive/negative
Clean price action setup
If 4+ boxes checked = High probability trade
Setting Up Alerts:
Click the three dots on the indicator
Select "Create Alert"
Choose condition:
"Institutional Buy Signal"
"Institutional Sell Signal"
"Dark Pool Activity"
Set up notification (email, SMS, app)
Save alert
Alert Strategy:
Set minimum strength to 4 for fewer, better alerts
Use for assets you can't watch constantly
Don't rely solely on alerts - check chart context
Practice Exercise:
Week 1-2: Observation
Add indicator to your favorite assets
Watch how signals develop
Note which ones lead to profitable moves
Don't trade yet - just observe
Week 3-4: Paper Trading
Use TradingView's paper trading
Trade only strength 4-5 signals
Record results in a journal
Note: entry, exit, profit/loss, what worked/didn't
Week 5+: Small Live Positions
Start with smallest position size
Trade only your best setups
Gradually increase size as you gain confidence
Keep detailed journal
Quick Reference Card:
Signal Quality Ranking:
🔥 Best Setups (Take These):
Strength 5 + Liquidity grab + Key level
Strength 4-5 + Volume >3.0 + Trend alignment
Dark Pool markers + Strength 4+ signal
✅ Good Setups:
Strength 4 at support/resistance
Strength 3-4 with strong delta
Liquidity grab + Strength 3+
⚠️ Caution (Wait for More):
Strength 2-3 in middle of nowhere
Against higher timeframe trend
Low volume (Rel Vol <1.5)
❌ Avoid:
Strength 2 only
During major news
Low liquidity hours
Against strong trend
Troubleshooting:
"Too many signals"
→ Increase Minimum Signal Strength to 4
→ Increase Volume Spike Multiplier to 2.5-3.0
"Too few signals"
→ Decrease Minimum Signal Strength to 2-3
→ Decrease Volume Spike Multiplier to 1.5
"Signals not working"
→ Check if you're trading during low volume hours
→ Verify you're using recommended timeframes
→ Make sure signals align with market structure
"Can't see liquidity zones"
→ Enable "Show Liquidity Zones" in settings
→ Adjust Swing Detection Length (try 7-15)
Resources for Further Learning:
Concepts to Study:
Order Flow Trading
Market Profile / Volume Profile
Smart Money Concepts (SMC)
Liquidity Sweeps and Stop Hunts
Institutional Order Flow
Wyckoff Method
Volume Spread Analysis (VSA)
Recommended Practice:
Study past signals on chart
Replay market using TradingView's bar replay feature
Join trading communities to share setups
Keep a detailed trading journal
Final Thoughts:
This indicator is a tool, not a crystal ball. It identifies high-probability setups where institutions are active, but still requires:
Proper risk management
Market context understanding
Patience and discipline
Continuous learning
Success Formula:
Right Tool + Proper Training + Risk Management + Discipline = Consistent Profits
Start slow, master the basics, and gradually increase complexity as you gain experience.
Good luck and trade smart! 📊📈
오픈 소스 스크립트
진정한 트레이딩뷰 정신에 따라 이 스크립트 작성자는 트레이더가 기능을 검토하고 검증할 수 있도록 오픈소스로 공개했습니다. 작성자에게 찬사를 보냅니다! 무료로 사용할 수 있지만 코드를 다시 게시할 경우 하우스 룰이 적용된다는 점을 기억하세요.
면책사항
이 정보와 게시물은 TradingView에서 제공하거나 보증하는 금융, 투자, 거래 또는 기타 유형의 조언이나 권고 사항을 의미하거나 구성하지 않습니다. 자세한 내용은 이용 약관을 참고하세요.
오픈 소스 스크립트
진정한 트레이딩뷰 정신에 따라 이 스크립트 작성자는 트레이더가 기능을 검토하고 검증할 수 있도록 오픈소스로 공개했습니다. 작성자에게 찬사를 보냅니다! 무료로 사용할 수 있지만 코드를 다시 게시할 경우 하우스 룰이 적용된다는 점을 기억하세요.
면책사항
이 정보와 게시물은 TradingView에서 제공하거나 보증하는 금융, 투자, 거래 또는 기타 유형의 조언이나 권고 사항을 의미하거나 구성하지 않습니다. 자세한 내용은 이용 약관을 참고하세요.