PROTECTED SOURCE SCRIPT
Sessions_X
📊 Session_x Indicator - Master Documentation
Overview
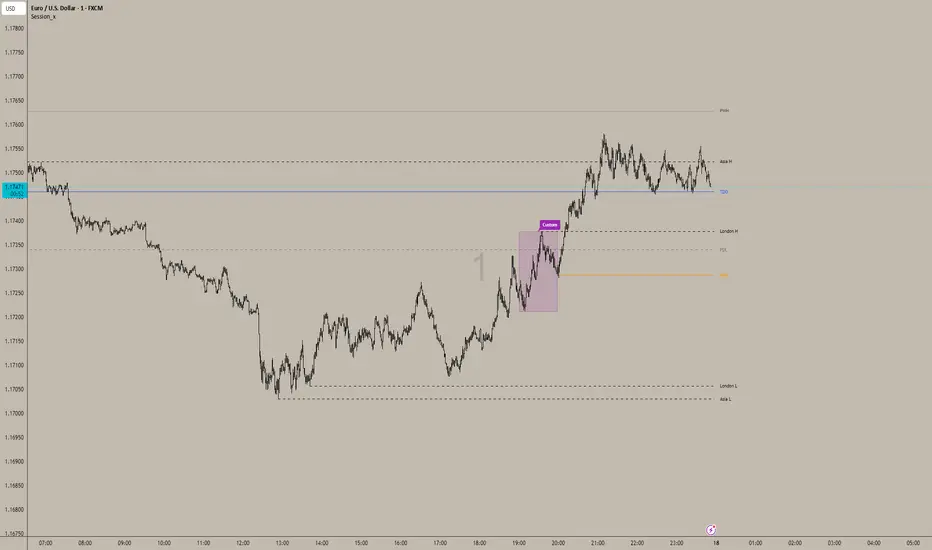
Session_x is a comprehensive ICT/SMC trading toolkit designed for precision intraday trading. It visualizes key session timings, liquidity levels (Highs/Lows), and institutional opening prices. The indicator features a "Smart History" system that keeps the current trading day clean with actionable lines, while converting previous days into visual boxes for back testing and review.
________________________________________
🌟 Key Features
1. 🕒 Session Logic (Current Day vs. History)
The indicator handles the Asian and London sessions dynamically to keep your chart clutter-free.
• Current Day (Live):
o Draws Lines representing the Session High and Low.
o Wick Precision: The lines start exactly from the candle wick that created the High or Low (not the session start time).
o Extensions: Lines extend to the right to act as live support/resistance.
o Labels: Clearly labelled (e.g., "Asia H", "London L") on the right side.
• Previous Days (History):
o Once the trading day closes (midnight), the lines are automatically deleted.
o They are replaced by a Shaded Box covering the session's range (High to Low, Start Time to End Time).
o Customizable: You can set separate styles (colors, borders) for the live lines and the history boxes.
2. 📦 Custom Time Box
A completely independent tool to track a specific time window (e.g., a "Silver Bullet" hour or a specific news window).
• Always a Box: Unlike Asia/London, this feature draws a box immediately when the time starts, both for the current day and history.
• Precision: Snaps exactly to the High and Low wicks within that time range.
3. 🔑 Institutional Levels
• TDO (True Day Open): Marks the opening price at 00:00 (NY Time). This line extends indefinitely throughout the current day to act as a bias filter.
• NYO (New York Open): Marks the opening price at 09:30 (NY Time). This line extends only for the current trading day and stops at the end of the day to prevent overlap.
4. 📈 High Timeframe Liquidity
• PDH / PDL (Previous Day High/Low): Dashed lines marking yesterday's range.
• PWH / PWL (Previous Week High/Low): Dotted lines marking the previous week's range.
• Note: These lines extend automatically and update at the start of a new day or week.
5. 🌊 EMA Ribbon
A trend-following tool consisting of 4 customizable Exponential Moving Averages.
• Defaults: 9, 20, 50, 200 lengths.
• Editable: You can toggle the ribbon on/off and change the Length, Colour, and Thickness of every individual EMA.
6. 🔔 Built-in Alerts
Automated alerts to notify you of key session breakouts:
• London Breakout: Triggers when price crosses the Asian Session High or Low during the London session.
• NY Breakout: Triggers when price crosses the London Session High or Low during the New York session.
________________________________________
⚙️ Settings Guide
You can access these settings by double-clicking the indicator on your chart.
1. Time zone & History
• Indicator Time zone: Default is America/New York. All session times below refer to this time zone.
• Days to Keep History: Controls how far back the boxes and lines appear (default is 3 days). Increase this to see more history, decrease it to improve chart performance.
2. Labels & Separators
• Show Names: Toggle text labels on/off.
• Text Colour/Size: Customize the look of the labels ("Asia H", "PDH", etc.).
• Day Separator: A vertical line drawn at 00:00 to visually separate trading days.
3. Session Settings (Asia / London)
• Time: Define the start and end time (e.g., 0200-0500).
• Current Day Lines: Controls the look of the active dashed lines.
• History Boxes: Controls the look of the shaded boxes that appear after the day finishes.
4. Custom Box
• Time: Set your custom time range (e.g., 1000-1100).
• Style: Controls the Border Colour, Width, and Background transparency.
5. Key Levels & HTF
• TDO / NYO: Enable/Disable and style the True Day Open and NY Open lines.
• PDH/PDL & PWH/PWL: Enable/Disable and style Previous Day/Week levels.
________________________________________
🚀 How to Trade with It
1. Bias Determination: Use the TDO line. If price is above TDO, look for longs. If below, look for shorts.
2. Liquidity Targets: Use PDH/PDL and PWH/PWL as major targets for take-profits.
3. Session Sweeps (Judas Swing):
o Watch for the London Session to sweep the Asian High/Low (Alert provided).
o Watch for the NY Session to sweep the London High/Low (Alert provided).
4. Trend: Use the EMA Ribbon. If the fast EMAs (9, 20) are above the slow EMAs (50, 200), the trend is bullish.
Overview
Session_x is a comprehensive ICT/SMC trading toolkit designed for precision intraday trading. It visualizes key session timings, liquidity levels (Highs/Lows), and institutional opening prices. The indicator features a "Smart History" system that keeps the current trading day clean with actionable lines, while converting previous days into visual boxes for back testing and review.
________________________________________
🌟 Key Features
1. 🕒 Session Logic (Current Day vs. History)
The indicator handles the Asian and London sessions dynamically to keep your chart clutter-free.
• Current Day (Live):
o Draws Lines representing the Session High and Low.
o Wick Precision: The lines start exactly from the candle wick that created the High or Low (not the session start time).
o Extensions: Lines extend to the right to act as live support/resistance.
o Labels: Clearly labelled (e.g., "Asia H", "London L") on the right side.
• Previous Days (History):
o Once the trading day closes (midnight), the lines are automatically deleted.
o They are replaced by a Shaded Box covering the session's range (High to Low, Start Time to End Time).
o Customizable: You can set separate styles (colors, borders) for the live lines and the history boxes.
2. 📦 Custom Time Box
A completely independent tool to track a specific time window (e.g., a "Silver Bullet" hour or a specific news window).
• Always a Box: Unlike Asia/London, this feature draws a box immediately when the time starts, both for the current day and history.
• Precision: Snaps exactly to the High and Low wicks within that time range.
3. 🔑 Institutional Levels
• TDO (True Day Open): Marks the opening price at 00:00 (NY Time). This line extends indefinitely throughout the current day to act as a bias filter.
• NYO (New York Open): Marks the opening price at 09:30 (NY Time). This line extends only for the current trading day and stops at the end of the day to prevent overlap.
4. 📈 High Timeframe Liquidity
• PDH / PDL (Previous Day High/Low): Dashed lines marking yesterday's range.
• PWH / PWL (Previous Week High/Low): Dotted lines marking the previous week's range.
• Note: These lines extend automatically and update at the start of a new day or week.
5. 🌊 EMA Ribbon
A trend-following tool consisting of 4 customizable Exponential Moving Averages.
• Defaults: 9, 20, 50, 200 lengths.
• Editable: You can toggle the ribbon on/off and change the Length, Colour, and Thickness of every individual EMA.
6. 🔔 Built-in Alerts
Automated alerts to notify you of key session breakouts:
• London Breakout: Triggers when price crosses the Asian Session High or Low during the London session.
• NY Breakout: Triggers when price crosses the London Session High or Low during the New York session.
________________________________________
⚙️ Settings Guide
You can access these settings by double-clicking the indicator on your chart.
1. Time zone & History
• Indicator Time zone: Default is America/New York. All session times below refer to this time zone.
• Days to Keep History: Controls how far back the boxes and lines appear (default is 3 days). Increase this to see more history, decrease it to improve chart performance.
2. Labels & Separators
• Show Names: Toggle text labels on/off.
• Text Colour/Size: Customize the look of the labels ("Asia H", "PDH", etc.).
• Day Separator: A vertical line drawn at 00:00 to visually separate trading days.
3. Session Settings (Asia / London)
• Time: Define the start and end time (e.g., 0200-0500).
• Current Day Lines: Controls the look of the active dashed lines.
• History Boxes: Controls the look of the shaded boxes that appear after the day finishes.
4. Custom Box
• Time: Set your custom time range (e.g., 1000-1100).
• Style: Controls the Border Colour, Width, and Background transparency.
5. Key Levels & HTF
• TDO / NYO: Enable/Disable and style the True Day Open and NY Open lines.
• PDH/PDL & PWH/PWL: Enable/Disable and style Previous Day/Week levels.
________________________________________
🚀 How to Trade with It
1. Bias Determination: Use the TDO line. If price is above TDO, look for longs. If below, look for shorts.
2. Liquidity Targets: Use PDH/PDL and PWH/PWL as major targets for take-profits.
3. Session Sweeps (Judas Swing):
o Watch for the London Session to sweep the Asian High/Low (Alert provided).
o Watch for the NY Session to sweep the London High/Low (Alert provided).
4. Trend: Use the EMA Ribbon. If the fast EMAs (9, 20) are above the slow EMAs (50, 200), the trend is bullish.
보호된 스크립트입니다
이 스크립트는 비공개 소스로 게시됩니다. 하지만 이를 자유롭게 제한 없이 사용할 수 있습니다 – 자세한 내용은 여기에서 확인하세요.
면책사항
해당 정보와 게시물은 금융, 투자, 트레이딩 또는 기타 유형의 조언이나 권장 사항으로 간주되지 않으며, 트레이딩뷰에서 제공하거나 보증하는 것이 아닙니다. 자세한 내용은 이용 약관을 참조하세요.
면책사항
해당 정보와 게시물은 금융, 투자, 트레이딩 또는 기타 유형의 조언이나 권장 사항으로 간주되지 않으며, 트레이딩뷰에서 제공하거나 보증하는 것이 아닙니다. 자세한 내용은 이용 약관을 참조하세요.