OPEN-SOURCE SCRIPT
업데이트됨 POCs and VAHs VALs - All and Non-Broken
The "POC and VAH VAL - All and Non-Broken"
POC = Points of Control
VAH = Value Area High
VAL = Value Area Low
This indicator aims to show you on the 5 minute time frame all POCs and VAHs/VALs and Non-Broken POCs and VAHs/VALs.
(Non-Broken are POCS and VAHs/VALS where price action has not since crossed its path)
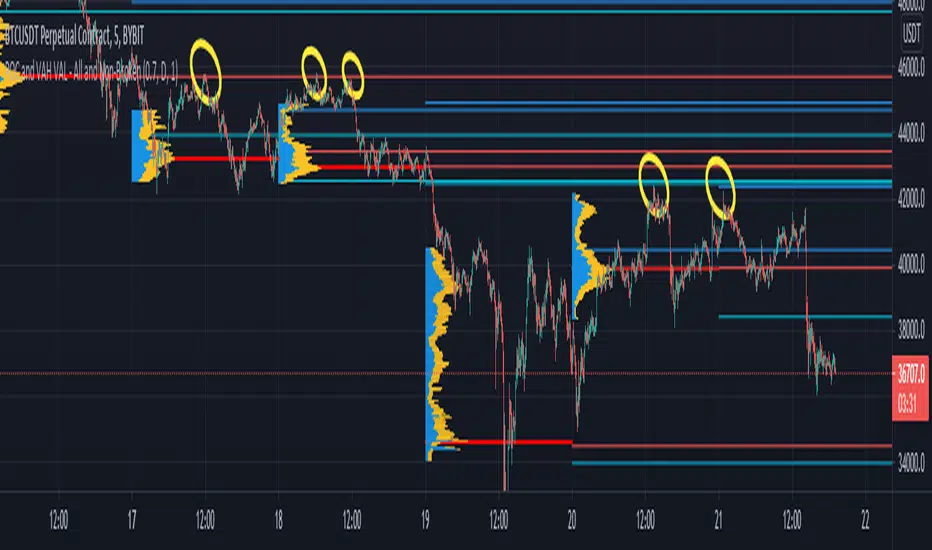
In the screen image above I have used VPVR to back test on BYBIT:BTCUSDT.
The POCs and VAHs/VALs for each day can be seen.
Also there is an option to see non-broken POCS and VAHs/VALs within the settings.
All display options are selectable within the settings.
The indicator is not as precise as using the VPVR but is a lot quicker and gives you a quick snapshot to assist with your technical analysis.
In the screen shot above are some examples highlighted with yellow circles (resistance at POC and VAHs/VALs).
Thanks goes to:
ahancock for use of his code.
Bjorn Mistiaen on StackOverFlow for his assistance.
Disclaimer:
Indicator has been coded to only show on 5 min time frame (after back testing seemed most accurate).
Only back tested on BYBIT:BTCUST.
There are some slight discrepancies.
Back tested against VPVR settings: Row Size 500, Value Area 70.
Maximum of 500 lines will only be shown.
POC = Points of Control
VAH = Value Area High
VAL = Value Area Low
This indicator aims to show you on the 5 minute time frame all POCs and VAHs/VALs and Non-Broken POCs and VAHs/VALs.
(Non-Broken are POCS and VAHs/VALS where price action has not since crossed its path)
In the screen image above I have used VPVR to back test on BYBIT:BTCUSDT.
The POCs and VAHs/VALs for each day can be seen.
Also there is an option to see non-broken POCS and VAHs/VALs within the settings.
All display options are selectable within the settings.
The indicator is not as precise as using the VPVR but is a lot quicker and gives you a quick snapshot to assist with your technical analysis.
In the screen shot above are some examples highlighted with yellow circles (resistance at POC and VAHs/VALs).
Thanks goes to:
ahancock for use of his code.
Bjorn Mistiaen on StackOverFlow for his assistance.
Disclaimer:
Indicator has been coded to only show on 5 min time frame (after back testing seemed most accurate).
Only back tested on BYBIT:BTCUST.
There are some slight discrepancies.
Back tested against VPVR settings: Row Size 500, Value Area 70.
Maximum of 500 lines will only be shown.
릴리즈 노트
User highlighted that only the unbroken POCs/VAHs/VALs below the current price were showing on the chart. Script has now been updated to show the unbroken above and below current price.
오픈 소스 스크립트
트레이딩뷰의 진정한 정신에 따라, 이 스크립트의 작성자는 이를 오픈소스로 공개하여 트레이더들이 기능을 검토하고 검증할 수 있도록 했습니다. 작성자에게 찬사를 보냅니다! 이 코드는 무료로 사용할 수 있지만, 코드를 재게시하는 경우 하우스 룰이 적용된다는 점을 기억하세요.
면책사항
해당 정보와 게시물은 금융, 투자, 트레이딩 또는 기타 유형의 조언이나 권장 사항으로 간주되지 않으며, 트레이딩뷰에서 제공하거나 보증하는 것이 아닙니다. 자세한 내용은 이용 약관을 참조하세요.
오픈 소스 스크립트
트레이딩뷰의 진정한 정신에 따라, 이 스크립트의 작성자는 이를 오픈소스로 공개하여 트레이더들이 기능을 검토하고 검증할 수 있도록 했습니다. 작성자에게 찬사를 보냅니다! 이 코드는 무료로 사용할 수 있지만, 코드를 재게시하는 경우 하우스 룰이 적용된다는 점을 기억하세요.
면책사항
해당 정보와 게시물은 금융, 투자, 트레이딩 또는 기타 유형의 조언이나 권장 사항으로 간주되지 않으며, 트레이딩뷰에서 제공하거나 보증하는 것이 아닙니다. 자세한 내용은 이용 약관을 참조하세요.