OPEN-SOURCE SCRIPT
Solar Recent Resistance / Support levels
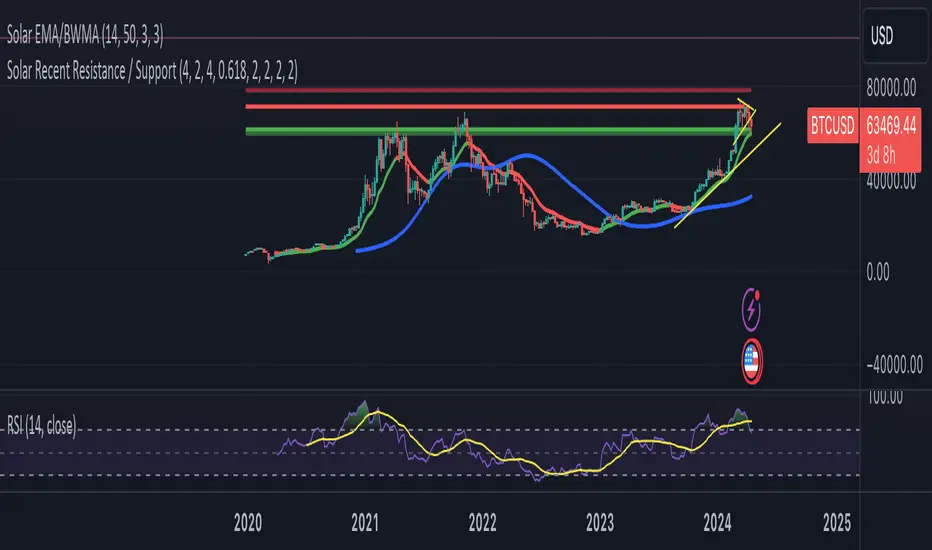
Solar Recent Resistance / Support Indicator
The Solar Recent Resistance / Support indicator is designed to identify recent resistance and support levels based on Fibonacci retracement levels. It helps traders visualize potential price barriers and significant levels where price action may encounter obstacles or find support.
Features:
Fibonacci Levels: The indicator calculates Fibonacci retracement levels based on the specified length and Fibonacci multiplier.
Recent Resistance Line: Displays a trend line representing the most recent resistance level identified by the indicator.
Next Resistance Line: Indicates the next significant resistance level above the current resistance level. The level is calculated based on a multiplier factor.
Recent Support Line: Shows a trend line denoting the most recent support level identified by the indicator.
Previous Support Line: Represents the support level before the current support, aiding in identifying historical support zones.
Usage:
Traders can use the indicator to identify potential areas of price reversal or consolidation.
The recent resistance and support lines can act as reference points for setting profit targets and stop-loss levels.
The next resistance line provides insight into potential future price movements, helping traders anticipate market behavior.
Parameters:
Fibonacci Length: Specifies the length of the Fibonacci retracement calculation.
Fibonacci Multiplier: Determines the multiplier factor for calculating the next resistance level.
Line Width: Adjusts the width of the plotted trend lines.
Resistance Color: Sets the color of the resistance lines.
Support Color: Defines the color of the support lines.
Fibonacci Level: Specifies the Fibonacci level used in the calculations.
Show Resistance Line: Enables or disables the display of resistance lines.
Show Support Line: Enables or disables the display of support lines.
Note:
Adjust the Fibonacci multiplier value to ensure that the next resistance level accurately reflects significant price barriers.
오픈 소스 스크립트
트레이딩뷰의 진정한 정신에 따라, 이 스크립트의 작성자는 이를 오픈소스로 공개하여 트레이더들이 기능을 검토하고 검증할 수 있도록 했습니다. 작성자에게 찬사를 보냅니다! 이 코드는 무료로 사용할 수 있지만, 코드를 재게시하는 경우 하우스 룰이 적용된다는 점을 기억하세요.
면책사항
해당 정보와 게시물은 금융, 투자, 트레이딩 또는 기타 유형의 조언이나 권장 사항으로 간주되지 않으며, 트레이딩뷰에서 제공하거나 보증하는 것이 아닙니다. 자세한 내용은 이용 약관을 참조하세요.
오픈 소스 스크립트
트레이딩뷰의 진정한 정신에 따라, 이 스크립트의 작성자는 이를 오픈소스로 공개하여 트레이더들이 기능을 검토하고 검증할 수 있도록 했습니다. 작성자에게 찬사를 보냅니다! 이 코드는 무료로 사용할 수 있지만, 코드를 재게시하는 경우 하우스 룰이 적용된다는 점을 기억하세요.
면책사항
해당 정보와 게시물은 금융, 투자, 트레이딩 또는 기타 유형의 조언이나 권장 사항으로 간주되지 않으며, 트레이딩뷰에서 제공하거나 보증하는 것이 아닙니다. 자세한 내용은 이용 약관을 참조하세요.