OPEN-SOURCE SCRIPT
업데이트됨 Monthly Returns in Strategies with Market Benchmark
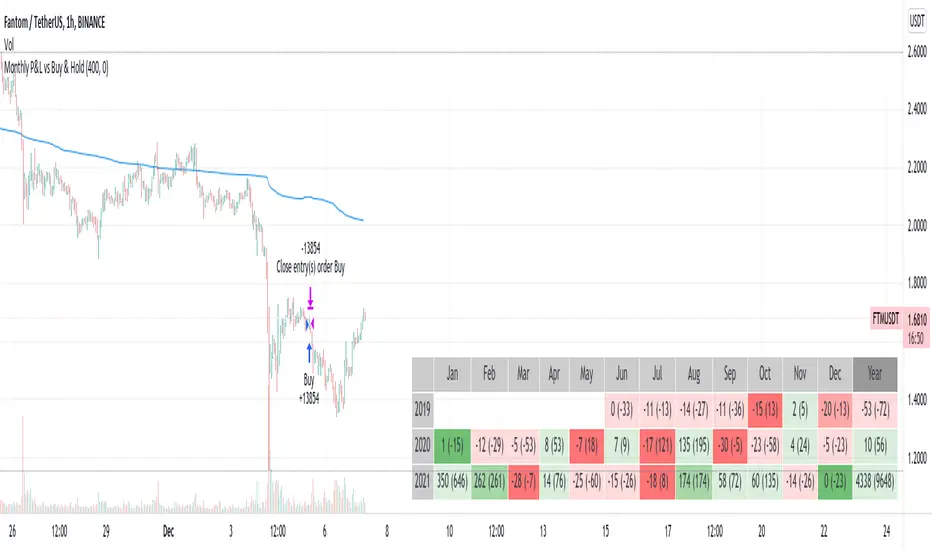
This is a modified version of this excellent script Monthly Returns in PineScript Strategues by QuantNomad
I liked and used the script but wanted to see how strategy performed vs market on each month/year. So I am sharing back.
The modification consists in adding Market or Buy & Hold performance between parenthesis inside each cell to better see how strategy performed vs market.
Also, 3 red levels and 3 green levels have been used :
For green :
1/ Light when strategy pnl > 0 but < market
2/ medium when strategy pnl > 0 and > market
3/ Dark when strategy pnl > 0 and market < 0 or pnl > market x 2
Same logic in the opposite direction for red.
The strategy provided here is just a showcase of how to use the table in pine script.
Disclaimer
Please remember that past performance may not be indicative of future results.
Due to various factors, including changing market conditions, the strategy may no longer perform as well as in historical backtesting.
This post and the script don’t provide any financial advice.
릴리즈 노트
Refactor code릴리즈 노트
Fixed bug with red color level릴리즈 노트
Get number precision as input (0 => no digit after the decimal point, 1 => 1 digit after decimal point etc.)오픈 소스 스크립트
트레이딩뷰의 진정한 정신에 따라, 이 스크립트의 작성자는 이를 오픈소스로 공개하여 트레이더들이 기능을 검토하고 검증할 수 있도록 했습니다. 작성자에게 찬사를 보냅니다! 이 코드는 무료로 사용할 수 있지만, 코드를 재게시하는 경우 하우스 룰이 적용된다는 점을 기억하세요.
면책사항
해당 정보와 게시물은 금융, 투자, 트레이딩 또는 기타 유형의 조언이나 권장 사항으로 간주되지 않으며, 트레이딩뷰에서 제공하거나 보증하는 것이 아닙니다. 자세한 내용은 이용 약관을 참조하세요.
오픈 소스 스크립트
트레이딩뷰의 진정한 정신에 따라, 이 스크립트의 작성자는 이를 오픈소스로 공개하여 트레이더들이 기능을 검토하고 검증할 수 있도록 했습니다. 작성자에게 찬사를 보냅니다! 이 코드는 무료로 사용할 수 있지만, 코드를 재게시하는 경우 하우스 룰이 적용된다는 점을 기억하세요.
면책사항
해당 정보와 게시물은 금융, 투자, 트레이딩 또는 기타 유형의 조언이나 권장 사항으로 간주되지 않으며, 트레이딩뷰에서 제공하거나 보증하는 것이 아닙니다. 자세한 내용은 이용 약관을 참조하세요.