INVITE-ONLY SCRIPT
Breakout Hunter [ZuperView]
Based on 2 concepts from Wyckoff Theory, accumulation and distribution zones may reflect the balance of power between buyers and sellers:
Most traders wait for major accumulation/distribution phases, but it takes days or weeks to form. Breakout Hunter lets you take advantage of micro phases – smaller, quicker setups ideal for scalping or intraday trades.
It is a highly customizable indicator that helps you visualize where the market builds up energy. Whether price breaks in line with or against the prior move, it adapts, helping you trade both continuations and reversals.
📌 Key features
Breakout Hunter provides 2 modes for you to choose from:
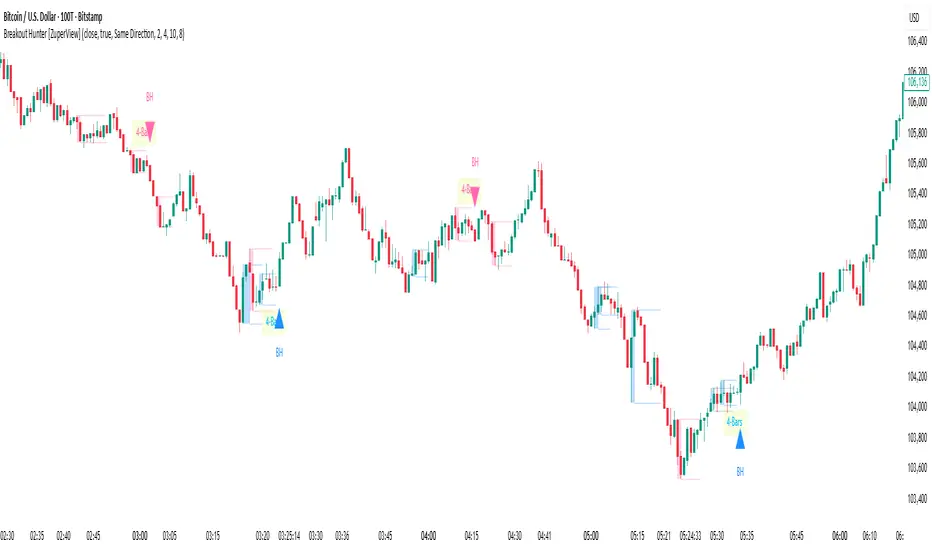
🔸 Same Direction Mode (For successful breakouts)
With this mode, Breakout Hunter will look for and signal breakouts after a successful Distribution/Accumulation phase.

Bullish setup:
1. Breakout Hunter identifies n consecutive bullish candles.

2. Then, it determines the range using the highest high and the lowest low of these candles. This forms a short-term accumulation zone.

3. When price breaks above this range, a bullish signal is triggered.

Bearish setup:
1. Breakout Hunter identifies n consecutive bearish candles.

2. Then, it determines the range using the highest high and the lowest low of these candles. This forms a short-term distribution zone.

3. When the price breaks below this range, a bearish signal is triggered.

🔸 Any Direction Mode (For both successful and failed breakouts)
This mode allows you to get both successful and failed breakouts. So, you can capture entry signals in either direction after an accumulation/distribution phase.
Here is how this mode works:

1. The indicator identifies n consecutive candles followed by a short consolidation phase.
2. If price breaks beyond the range in any direction, a breakout signal is triggered:
Here’s an example of a successful breakout:
After a period of accumulation, price broke out to the upside – the same direction as the phase – indicating a successful breakout, and the indicator triggered a buy signal.

Another example for a failed breakout:
Price attempted to break above the accumulation range but quickly reversed, and the indicator triggered a sell signal.

This mode is ideal for traders who want to capture continuations and reversals alike.
📌 Customization
🔸 Mode: There are 2 modes:
🔸 Period: Number of consecutive bullish/bearish candles.
For example:


🔸 Qualifying Age (Bars): Minimum bars required for a valid range.
This defines how many candles are needed within the Accumulation/Distribution range for it to be considered valid.

🔸 Min High (Ticks): Minimum height (in ticks) for a series of bullish or bearish candles to be recognized as a price increase/decrease.
For example:

🔸 Signal Split Bars: This setting sets the minimum spacing between 2 signals in the same direction (reduces noise).
- Accumulation → buyers absorb supply, preparing for a rally.
- Distribution → sellers absorb demand, preparing for a decline.
Most traders wait for major accumulation/distribution phases, but it takes days or weeks to form. Breakout Hunter lets you take advantage of micro phases – smaller, quicker setups ideal for scalping or intraday trades.
It is a highly customizable indicator that helps you visualize where the market builds up energy. Whether price breaks in line with or against the prior move, it adapts, helping you trade both continuations and reversals.
📌 Key features
Breakout Hunter provides 2 modes for you to choose from:
🔸 Same Direction Mode (For successful breakouts)
With this mode, Breakout Hunter will look for and signal breakouts after a successful Distribution/Accumulation phase.
Bullish setup:
1. Breakout Hunter identifies n consecutive bullish candles.
2. Then, it determines the range using the highest high and the lowest low of these candles. This forms a short-term accumulation zone.
3. When price breaks above this range, a bullish signal is triggered.
Bearish setup:
1. Breakout Hunter identifies n consecutive bearish candles.
2. Then, it determines the range using the highest high and the lowest low of these candles. This forms a short-term distribution zone.
3. When the price breaks below this range, a bearish signal is triggered.
🔸 Any Direction Mode (For both successful and failed breakouts)
This mode allows you to get both successful and failed breakouts. So, you can capture entry signals in either direction after an accumulation/distribution phase.
Here is how this mode works:
1. The indicator identifies n consecutive candles followed by a short consolidation phase.
2. If price breaks beyond the range in any direction, a breakout signal is triggered:
- Breaks in the same direction → indicates a successful breakout.
- Breaks in the opposite direction → indicates a failed breakout or potential reversal.
Here’s an example of a successful breakout:
After a period of accumulation, price broke out to the upside – the same direction as the phase – indicating a successful breakout, and the indicator triggered a buy signal.
Another example for a failed breakout:
Price attempted to break above the accumulation range but quickly reversed, and the indicator triggered a sell signal.
This mode is ideal for traders who want to capture continuations and reversals alike.
📌 Customization
🔸 Mode: There are 2 modes:
- Same Direction Mode: Identify and signal breakout opportunities that align with the prevailing trend following a confirmed accumulation or distribution phase.
- Any Direction Mode: Detects both successful and failed breakout attempts after price consolidates in an accumulation or distribution range.
🔸 Period: Number of consecutive bullish/bearish candles.
For example:
- If you set the period to 5, the indicator will need to identify 5 consecutive bullish or bearish candles to form the range for Accumulation/Distribution.
- If you want to trade shorter-term and receive more signals, you can lower this value.
🔸 Qualifying Age (Bars): Minimum bars required for a valid range.
This defines how many candles are needed within the Accumulation/Distribution range for it to be considered valid.
🔸 Min High (Ticks): Minimum height (in ticks) for a series of bullish or bearish candles to be recognized as a price increase/decrease.
For example:
- If you set it to 10, the series must have a height of at least 10 ticks.
- If you want to receive more signals, values between 10 and 30 are recommended.
🔸 Signal Split Bars: This setting sets the minimum spacing between 2 signals in the same direction (reduces noise).
초대 전용 스크립트
이 스크립트는 작성자가 승인한 사용자만 접근할 수 있습니다. 사용하려면 요청을 보내고 승인을 받아야 합니다. 일반적으로 결제 후에 승인이 이루어집니다. 자세한 내용은 아래 작성자의 지침을 따르거나 ZuperView에게 직접 문의하세요.
트레이딩뷰는 스크립트 작성자를 완전히 신뢰하고 스크립트 작동 방식을 이해하지 않는 한 스크립트 비용을 지불하거나 사용하지 않는 것을 권장하지 않습니다. 무료 오픈소스 대체 스크립트는 커뮤니티 스크립트에서 찾을 수 있습니다.
작성자 지시 사항
To add the indicator to your chart, click "Indicators" → "Invite-only" → find and select the indicator to add it to the chart.
👉 Explore all indicators & systems: zuperview.com/
👉 Join our Discord: discord.gg/YKE6ujrw59
All content provided by ZuperView is for informational & educational purposes only. Past performance does not guarantee future results.
👉 Join our Discord: discord.gg/YKE6ujrw59
All content provided by ZuperView is for informational & educational purposes only. Past performance does not guarantee future results.
면책사항
이 정보와 게시물은 TradingView에서 제공하거나 보증하는 금융, 투자, 거래 또는 기타 유형의 조언이나 권고 사항을 의미하거나 구성하지 않습니다. 자세한 내용은 이용 약관을 참고하세요.