OPEN-SOURCE SCRIPT
업데이트됨 Multi Candle Body Mapper
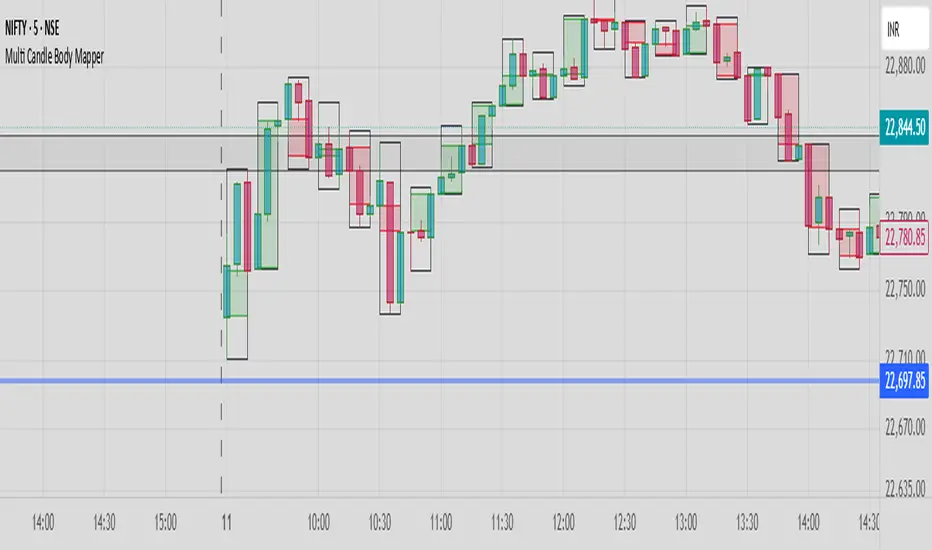
Multi Candle Body Mapper
Visualize higher-timeframe candle structure within lower timeframes — without switching charts.
This tool maps grouped candle bodies and wicks (e.g., 15min candles on a 5min chart) using precise boxes and lines. Ideal for intraday traders who want to analyze market intent, body bias, and wick rejection in a compressed, organized view.
Features:
Visualize 3, 6, or 12 candle groups (e.g., 15min / 30min / 1H views)
Body box shows bullish/bearish color with adjustable transparency
Wick box shows high-low range with adjustable thickness and color
Dashed line at group close level for market direction hint
Full color customization
Toggle individual elements ON/OFF
Clean overlay – doesn’t interfere with price candles
Great for spotting:
Hidden support/resistance
Momentum buildup
Reversal traps and continuation setups
Keep your chart simple but smarter — all without changing your timeframe.
릴리즈 노트
Multi Candle Body MapperVisualize higher-timeframe candle structure within lower timeframes — without switching charts.
This tool maps grouped candle bodies and wicks (e.g., 15min candles on a 5min chart) using precise boxes and lines. Ideal for intraday traders who want to analyze market intent, body bias, and wick rejection in a compressed, organized view.
Features:
Visualize 3, 6, or 12 candle groups (e.g., 15min / 30min / 1H views)
Body box shows bullish/bearish color with adjustable transparency
Wick box shows high-low range with adjustable thickness and color
Dashed line at group close level for market direction hint
Full color customization
Toggle individual elements ON/OFF
Clean overlay – doesn’t interfere with price candles
Great for spotting:
Hidden support/resistance
Momentum buildup
Reversal traps and continuation setups
Keep your chart simple but smarter — all without changing your timeframe.
오픈 소스 스크립트
트레이딩뷰의 진정한 정신에 따라, 이 스크립트의 작성자는 이를 오픈소스로 공개하여 트레이더들이 기능을 검토하고 검증할 수 있도록 했습니다. 작성자에게 찬사를 보냅니다! 이 코드는 무료로 사용할 수 있지만, 코드를 재게시하는 경우 하우스 룰이 적용된다는 점을 기억하세요.
면책사항
해당 정보와 게시물은 금융, 투자, 트레이딩 또는 기타 유형의 조언이나 권장 사항으로 간주되지 않으며, 트레이딩뷰에서 제공하거나 보증하는 것이 아닙니다. 자세한 내용은 이용 약관을 참조하세요.
오픈 소스 스크립트
트레이딩뷰의 진정한 정신에 따라, 이 스크립트의 작성자는 이를 오픈소스로 공개하여 트레이더들이 기능을 검토하고 검증할 수 있도록 했습니다. 작성자에게 찬사를 보냅니다! 이 코드는 무료로 사용할 수 있지만, 코드를 재게시하는 경우 하우스 룰이 적용된다는 점을 기억하세요.
면책사항
해당 정보와 게시물은 금융, 투자, 트레이딩 또는 기타 유형의 조언이나 권장 사항으로 간주되지 않으며, 트레이딩뷰에서 제공하거나 보증하는 것이 아닙니다. 자세한 내용은 이용 약관을 참조하세요.