OPEN-SOURCE SCRIPT
Chart CAGR
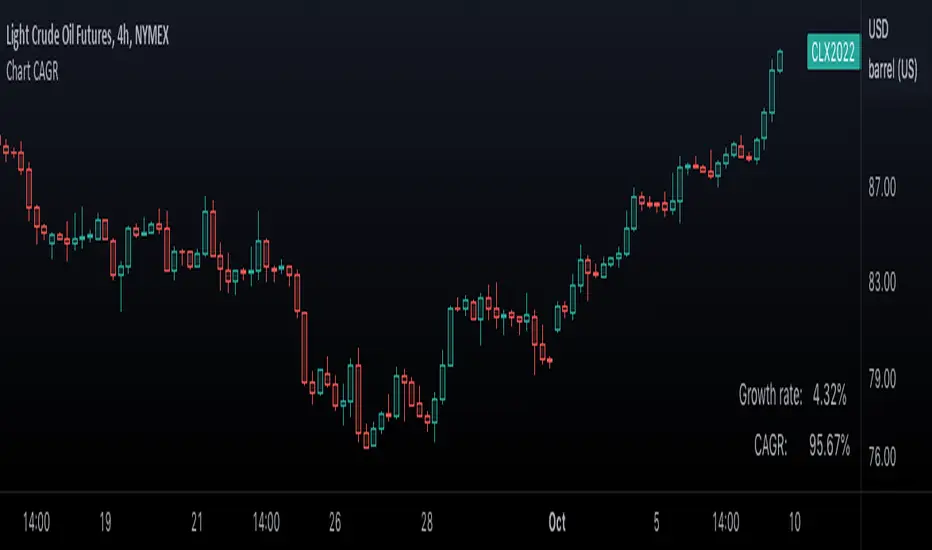
█ OVERVIEW
This simple script displays in the lower-right corner of the chart the Growth Rate and the Compound Annual Growth Rate (CAGR) between the open of the chart's first visible bar and the close of its last bar. As you zoom/scroll the chart, calculations will adjust to the chart's bars. You can change the location and colors of the displayed text in the script's settings.
If you need to calculate the CAGR between any two points on the chart, see our CAGR Custom Range indicator.
█ FOR Pine Script™ CODERS
Like our Chart VWAP publication, this script calculates on the range of visible bars utilizing the new Pine Script™ functions announced here and the VisibleChart library by PineCoders. It also uses the `cagr()` function from our ta library, which was recently augmented with many new functions.
Look first. Then leap.
오픈 소스 스크립트
트레이딩뷰의 진정한 정신에 따라, 이 스크립트의 작성자는 이를 오픈소스로 공개하여 트레이더들이 기능을 검토하고 검증할 수 있도록 했습니다. 작성자에게 찬사를 보냅니다! 이 코드는 무료로 사용할 수 있지만, 코드를 재게시하는 경우 하우스 룰이 적용된다는 점을 기억하세요.
Share TradingView with a friend:
tradingview.com/share-your-love/
Check out all #tradingviewtips
tradingview.com/ideas/tradingviewtips/?type=education
New Tools and Features:
tradingview.com/blog/en/
tradingview.com/share-your-love/
Check out all #tradingviewtips
tradingview.com/ideas/tradingviewtips/?type=education
New Tools and Features:
tradingview.com/blog/en/
면책사항
해당 정보와 게시물은 금융, 투자, 트레이딩 또는 기타 유형의 조언이나 권장 사항으로 간주되지 않으며, 트레이딩뷰에서 제공하거나 보증하는 것이 아닙니다. 자세한 내용은 이용 약관을 참조하세요.