PROTECTED SOURCE SCRIPT
ETHUSDT Long-Short using EMA,OBV,ADX,LinearReg,DXY(No repaint)
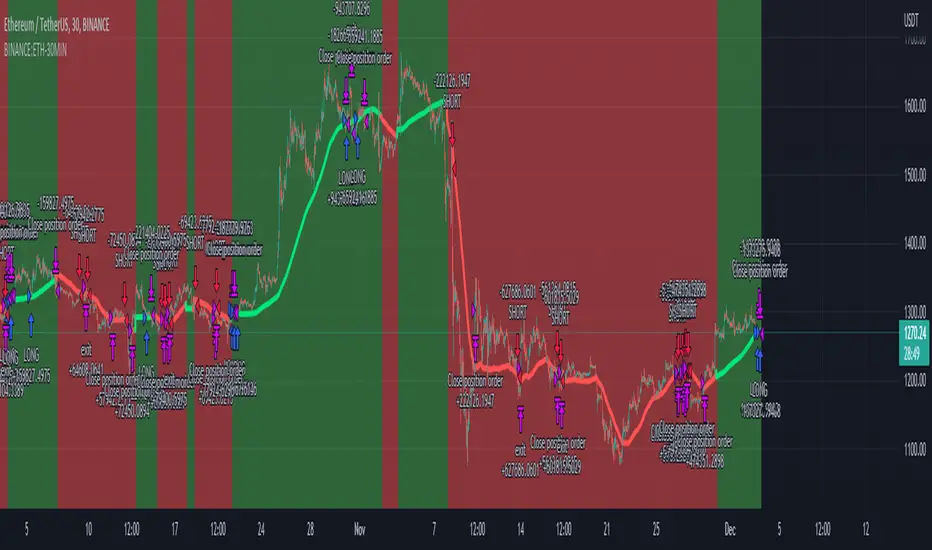
This script strategy is used to follow the trending EMA with a delta difference (Price-EMA) to know when to enter and with 5 variables mentioned below, stop loss is below EMA line all the time in long and above EMA line in short, is like a trailing stop after candle is closed. Hard stop is also placed to prevent big candles movements, also correlation between VIX and ETH when the correlation is <-0.2 the position can be opened.
Indicators used:
EMA , OBV , ADX , Linear regression and Dollar Index trending, Leverage is available for Long and Short positions.
LONG
SHORT

 ETHUSDT 30 minutes Timeframe
Indicators used:
EMA , OBV , ADX , Linear regression and Dollar Index trending, Leverage is available for Long and Short positions.
LONG
- When Price is above EMA and price-ema difference is smaller than "Long delta Price/MA"
- OBV(4hrs) is above OBV-EMA(110)
- Linear regression is strong
- ADX is strong >50
- DXY is trending down
SHORT
- When Price is below EMA and ema-price difference is smaller than "Long delta Price/MA"
- OBV(4hrs) is below OBV-EMA(110)
- Linear regression is weak
- ADX is weak <50
- DXY is trending up
보호된 스크립트입니다
이 스크립트는 비공개 소스로 게시됩니다. 하지만 이를 자유롭게 제한 없이 사용할 수 있습니다 – 자세한 내용은 여기에서 확인하세요.
면책사항
해당 정보와 게시물은 금융, 투자, 트레이딩 또는 기타 유형의 조언이나 권장 사항으로 간주되지 않으며, 트레이딩뷰에서 제공하거나 보증하는 것이 아닙니다. 자세한 내용은 이용 약관을 참조하세요.
면책사항
해당 정보와 게시물은 금융, 투자, 트레이딩 또는 기타 유형의 조언이나 권장 사항으로 간주되지 않으며, 트레이딩뷰에서 제공하거나 보증하는 것이 아닙니다. 자세한 내용은 이용 약관을 참조하세요.