OPEN-SOURCE SCRIPT
Kamal 5 Tick Trading Setup
Kamal 5 Tick Trading Setup
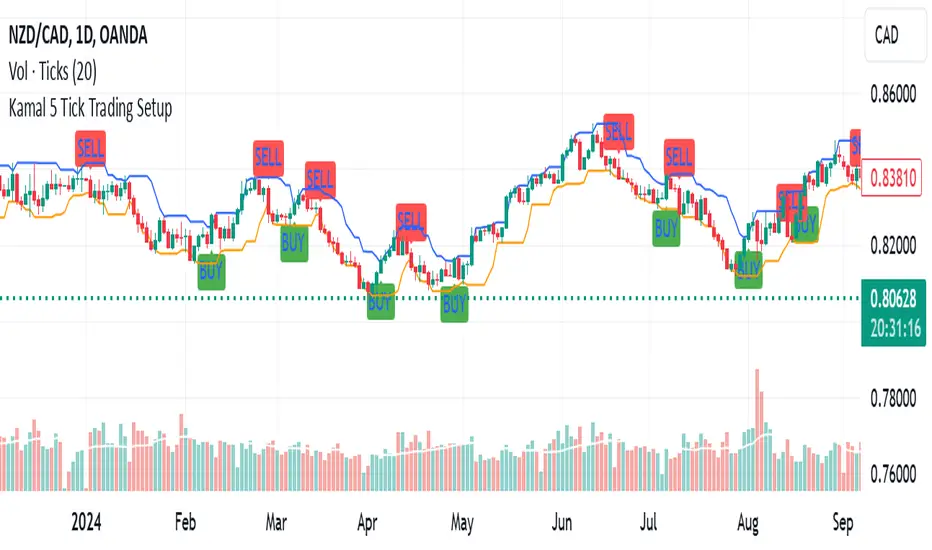
The "Kamal 5 Tick Trading Setup" is a custom indicator designed by Kamal Preet Singh Trader for TradingView to identify potential Buy and Sell signals on daily forex charts. This indicator helps traders make informed decisions based on the price action of the previous five daily candles.
Indicator Logic:
Buy Signal: A Buy signal is generated when the closing price of the current candle exceeds the highest high of the previous five daily candles.
Sell Signal: A Sell signal is generated when the closing price of the current candle falls below the lowest low of the previous five daily candles.
Features:
Lookback Period: The indicator uses a lookback period of five candles to determine the highest high and lowest low.
Visual Signals: Buy signals are plotted as green "BUY" labels below the candles, while Sell signals are plotted as red "SELL" labels above the candles.
Debugging Plots: The highest high and lowest low of the previous five candles are plotted as blue and orange lines, respectively, to help verify the conditions for Buy and Sell signals.
Non-Repetitive Signals: The indicator ensures that once a Buy signal is given, no further Buy signals are generated until a Sell signal is given, and vice versa.
Usage:
Apply the indicator to your daily forex chart in TradingView.
Observe the plotted Buy and Sell signals to identify potential entry and exit points.
Use the debugging plots to ensure the conditions for the signals are being met correctly.
This indicator provides a straightforward approach to trading based on recent price action, helping traders capitalize on potential breakout and breakdown opportunities.
오픈 소스 스크립트
트레이딩뷰의 진정한 정신에 따라, 이 스크립트의 작성자는 이를 오픈소스로 공개하여 트레이더들이 기능을 검토하고 검증할 수 있도록 했습니다. 작성자에게 찬사를 보냅니다! 이 코드는 무료로 사용할 수 있지만, 코드를 재게시하는 경우 하우스 룰이 적용된다는 점을 기억하세요.
Kamal Preet Singh Trader
면책사항
해당 정보와 게시물은 금융, 투자, 트레이딩 또는 기타 유형의 조언이나 권장 사항으로 간주되지 않으며, 트레이딩뷰에서 제공하거나 보증하는 것이 아닙니다. 자세한 내용은 이용 약관을 참조하세요.
오픈 소스 스크립트
트레이딩뷰의 진정한 정신에 따라, 이 스크립트의 작성자는 이를 오픈소스로 공개하여 트레이더들이 기능을 검토하고 검증할 수 있도록 했습니다. 작성자에게 찬사를 보냅니다! 이 코드는 무료로 사용할 수 있지만, 코드를 재게시하는 경우 하우스 룰이 적용된다는 점을 기억하세요.
Kamal Preet Singh Trader
면책사항
해당 정보와 게시물은 금융, 투자, 트레이딩 또는 기타 유형의 조언이나 권장 사항으로 간주되지 않으며, 트레이딩뷰에서 제공하거나 보증하는 것이 아닙니다. 자세한 내용은 이용 약관을 참조하세요.