OPEN-SOURCE SCRIPT
Anchored SMA
This is not your usual single moving average (SMA) indicator. It is an anchored SMA indicator. The anchored SMA does what other SMAs cannot--it stays at an anchored timeframe and presents that SMA relative to the timeframe you are in. For example, standard SMA indicators adjust to the timeframe you are viewing in your chart. So if you set it to a 20 day SMA while in the 1 Day timeframe, when you switch to the 5 minute timeframe, your 20 day SMA now becomes a 100 minute SMA indicator--that is it is only calculating the SMA for 20 ticks at 5 minutes each rather than holding the 20 day indicator at the higher timeframe. However, with the anchored SMA, the indicator would have held at the 20 day SMA while you were in the 5 minute timeframe.
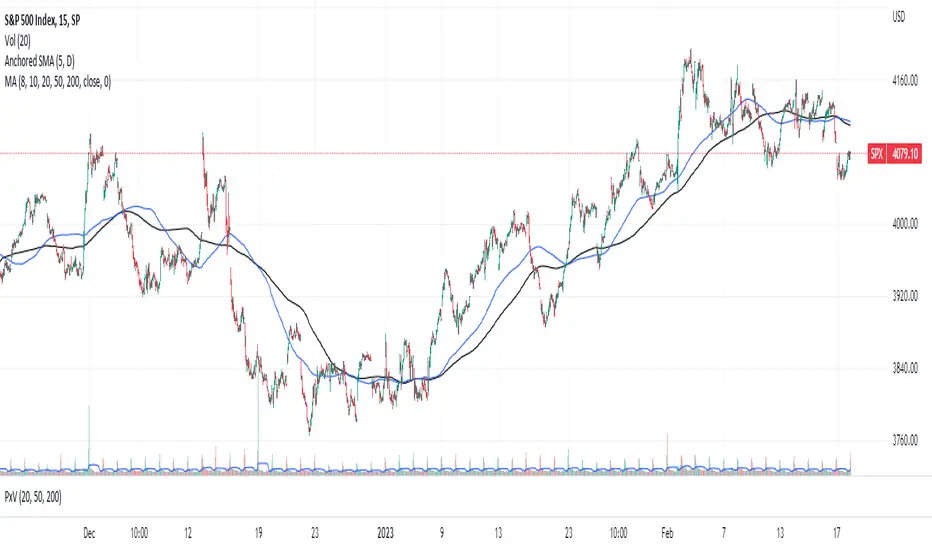
The default setting is for the anchored SMA is the five day SMA. This can be adjusted in the settings to be any amount of ticks in any timeframe you choose from 1 minute to 1 week. The indicator does not hold accurately at timeframes outside of this range. The accompanying chart is the SPX in the 15 minute timeframe with the default anchored SMA settings in blue and the standard 200 tick SMA in black. Now, you could manually adjust the ticks to 130 SMA to fit the same blue line, but why do so when the anchored SMA does it for you?
This brings us to a very important note--this indicator is set to standard market hours at 6.5 hours per day. This means this indicator would not give the same results in markets with different hours, such as futures, FOREX, or Crypto markets. This only holds for equity markets. However, that is not to say it cannot be used in these other markets, it's that it wouldn't be the same result. Anyway, enjoy!
오픈 소스 스크립트
트레이딩뷰의 진정한 정신에 따라, 이 스크립트의 작성자는 이를 오픈소스로 공개하여 트레이더들이 기능을 검토하고 검증할 수 있도록 했습니다. 작성자에게 찬사를 보냅니다! 이 코드는 무료로 사용할 수 있지만, 코드를 재게시하는 경우 하우스 룰이 적용된다는 점을 기억하세요.
면책사항
해당 정보와 게시물은 금융, 투자, 트레이딩 또는 기타 유형의 조언이나 권장 사항으로 간주되지 않으며, 트레이딩뷰에서 제공하거나 보증하는 것이 아닙니다. 자세한 내용은 이용 약관을 참조하세요.
오픈 소스 스크립트
트레이딩뷰의 진정한 정신에 따라, 이 스크립트의 작성자는 이를 오픈소스로 공개하여 트레이더들이 기능을 검토하고 검증할 수 있도록 했습니다. 작성자에게 찬사를 보냅니다! 이 코드는 무료로 사용할 수 있지만, 코드를 재게시하는 경우 하우스 룰이 적용된다는 점을 기억하세요.
면책사항
해당 정보와 게시물은 금융, 투자, 트레이딩 또는 기타 유형의 조언이나 권장 사항으로 간주되지 않으며, 트레이딩뷰에서 제공하거나 보증하는 것이 아닙니다. 자세한 내용은 이용 약관을 참조하세요.