OPEN-SOURCE SCRIPT
Triple Moving Average Crossover
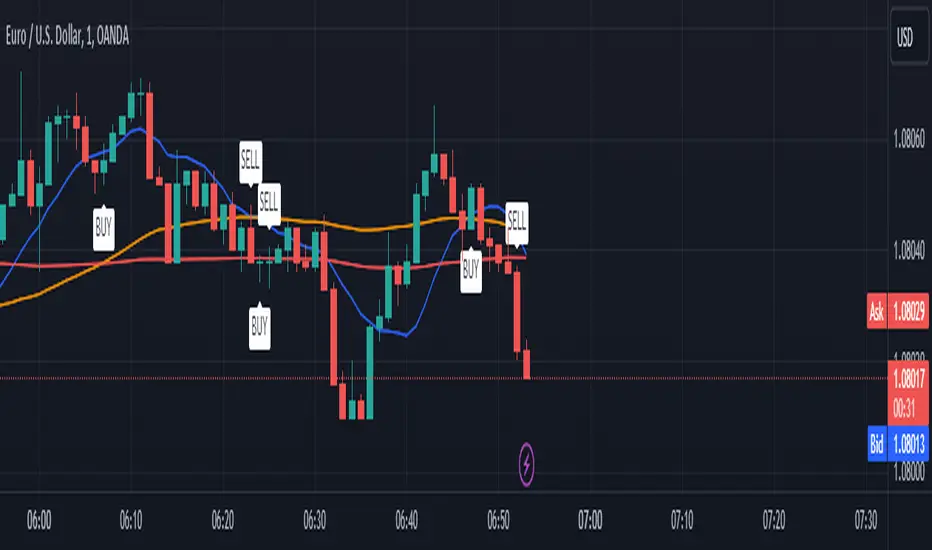
Below is the Pine Script code for TradingView that creates an indicator with three user-defined moving averages (with default periods of 10, 50, and 100) and labels for buy and sell signals at key crossovers. Additionally, it creates a label if the price increases by 100 points from the buy entry or decreases by 100 points from the sell entry, with the label saying "+100".
Explanation:
Indicator Definition: indicator("Triple Moving Average Crossover", overlay=true) defines the script as an indicator that overlays on the chart.
User Inputs: input.int functions allow users to define the periods for the short, middle, and long moving averages with defaults of 10, 50, and 100, respectively.
Moving Averages Calculation: The ta.sma function calculates the simple moving averages for the specified periods.
Plotting Moving Averages: plot functions plot the short, middle, and long moving averages on the chart with blue, orange, and red colors.
Crossover Detection: ta.crossover and ta.crossunder functions detect when the short moving average crosses above or below the middle moving average and when the middle moving average crosses above or below the long moving average.
Entry Price Tracking: Variables buyEntryPrice and sellEntryPrice store the buy and sell entry prices. These prices are updated whenever a bullish or bearish crossover occurs.
100 Points Move Detection: buyTargetReached checks if the current price has increased by 100 points from the buy entry price. sellTargetReached checks if the current price has decreased by 100 points from the sell entry price.
Plotting Labels: plotshape functions plot the buy and sell labels at the crossovers and the +100 labels when the target moves are reached. The labels are displayed in white and green colors.
오픈 소스 스크립트
트레이딩뷰의 진정한 정신에 따라, 이 스크립트의 작성자는 이를 오픈소스로 공개하여 트레이더들이 기능을 검토하고 검증할 수 있도록 했습니다. 작성자에게 찬사를 보냅니다! 이 코드는 무료로 사용할 수 있지만, 코드를 재게시하는 경우 하우스 룰이 적용된다는 점을 기억하세요.
면책사항
해당 정보와 게시물은 금융, 투자, 트레이딩 또는 기타 유형의 조언이나 권장 사항으로 간주되지 않으며, 트레이딩뷰에서 제공하거나 보증하는 것이 아닙니다. 자세한 내용은 이용 약관을 참조하세요.
오픈 소스 스크립트
트레이딩뷰의 진정한 정신에 따라, 이 스크립트의 작성자는 이를 오픈소스로 공개하여 트레이더들이 기능을 검토하고 검증할 수 있도록 했습니다. 작성자에게 찬사를 보냅니다! 이 코드는 무료로 사용할 수 있지만, 코드를 재게시하는 경우 하우스 룰이 적용된다는 점을 기억하세요.
면책사항
해당 정보와 게시물은 금융, 투자, 트레이딩 또는 기타 유형의 조언이나 권장 사항으로 간주되지 않으며, 트레이딩뷰에서 제공하거나 보증하는 것이 아닙니다. 자세한 내용은 이용 약관을 참조하세요.