INVITE-ONLY SCRIPT
업데이트됨 BANKNIFTY - PRICE ACTION TRADING SYSTEM

This study is based on several Price Action parameters of :-
• Candle Pattern,
• Supply Demands,
• Support and Resistance,
• Breakouts.
► How To Use This Study ?
• Suitable Trade Session for this study 09:45 AM to 02:30 PM ( UTC +05:30)
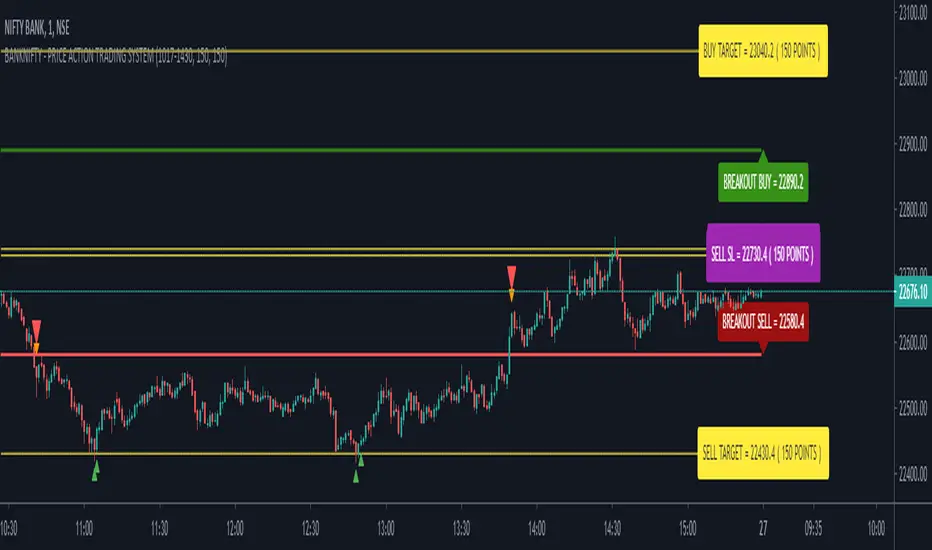
• Buy Whenever a Green Up Triangle Appears on Chart.
• Sell Whenever a Red Down Triangle Appears on Chart.
• Exit Buy Whenever a tiny Down Triangle Appears After A Buy call and Exit Sell Whenever a tiny up Arrow Appears After A Sell Call.
• Take Only 1 trade Per Trading Session.
Test Yourself and give feedback.
PM us to obtain access.
릴리즈 노트
Updated Alerts Conditions to avoid multiple alerts when Long or Short Condition is matched. Now alerts will be only generated when the condition is confirmed on last candle and confirmed alert will be fired on next candle , so no multiple alerts will be fired.Two Green Up Triangle Means Long Entry and entry price is now the opening of the candle on which signal appears.
Small Down red triangle means Long Exit, exit point is immediately when signal first appear on chart.
Two Red Down Triangle Means Short Entry and entry price is now the opening of the candle on which signal appears.
Small Up Green triangle means Short Exit, exit point is immediately when signal first appear on chart.
릴리즈 노트
Adjusted Few More Parameters for Better Matching Of Price Action Conditions. 릴리즈 노트
Added stoploss level on screen for manual traders.릴리즈 노트
Parameters Optimized For Better Performance.릴리즈 노트
What's New ?• Added Colors to Buy & Sell Zones, Red Color for SELL Zones and Green Color for BUY Zones.
• Added New EARLY EXIT Algorithm.
• Early Exit Algorithm will help you exit from wrong side position with up-to 70% of stop-loss savings.
• Now the new possible target and sl ratio will be minimum approx 1:2 and upto 1:4.
• Improved Compatibility for algo trading bridges with advanced and refined alert system.
릴리즈 노트
New Update -> 25-05-2020 :• Added Controlled Entry Algorithm (CEA), This will filter out 70% of false breakout calls.
• Adjusted Entry and exit parameters , Now there will be up-to 70% less "NO CALL" days.
• Entry time modified to 9:20 AM and Entry end time remained unchanged (14:30 PM).
릴리즈 노트
Temporary Disabled Breakout Price Action Algorithm.Activated Candle Sticks Price Action Trading Algorithm.
릴리즈 노트
Added Alerts For Target Hit or Profit Booking By Algo Trading System.Added Alerts For SL Hit or Loss Booking By Algo Trading System.
릴리즈 노트
Algorithm Optimized.릴리즈 노트
Algorithm Optimized릴리즈 노트
• Optimized for Early Entry• Fixed Target & SL
• Buy/Sell/Target/SL Values are made Visible on Chart
• Editable Target & Stop-loss Option Added
• Option Added to Show Hide Buy/Sell/Target/SL from Chart
• Trade Session Time Changed to 10:17 AM to 02:30 PM
초대 전용 스크립트
이 스크립트는 작성자가 승인한 사용자만 접근할 수 있습니다. 사용하려면 요청 후 승인을 받아야 하며, 일반적으로 결제 후에 허가가 부여됩니다. 자세한 내용은 아래 작성자의 안내를 따르거나 Algonize에게 직접 문의하세요.
트레이딩뷰는 스크립트의 작동 방식을 충분히 이해하고 작성자를 완전히 신뢰하지 않는 이상, 해당 스크립트에 비용을 지불하거나 사용하는 것을 권장하지 않습니다. 커뮤니티 스크립트에서 무료 오픈소스 대안을 찾아보실 수도 있습니다.
작성자 지시 사항
면책사항
해당 정보와 게시물은 금융, 투자, 트레이딩 또는 기타 유형의 조언이나 권장 사항으로 간주되지 않으며, 트레이딩뷰에서 제공하거나 보증하는 것이 아닙니다. 자세한 내용은 이용 약관을 참조하세요.