INVITE-ONLY SCRIPT
DinhChienFX Elliot targets 1.1
We need to make things better and to solve the struggles of traders conquering this ventures capital arena.
I present my new Elliot targets script.
Anyone learning the Elliot wave is very difficult and difficult to understand.
I would like to take a few parts of the Elliot wave theory that is how to calculate the retracement area
and price levels according to the Fibonacci ratio of the Elliot wave. A Then combine the basic indicators Bollinger Band, MACD-H and RSI
to predict the future of the market. And try to automate the above.
The idea in the Elliot targets scenario is to combine:
+ Oscillators indicator (Rsi - Relative Strength Index)
+ Center Oscillators indicator (MACD - Moving Average convergence Divergence)
+ Volatility indicator (BB - Bollinger Band).
There are some option in the script, let see:
- Bollinger Band: calculates trend with signal combination from Bollinger Band indicator.
- RSI: calculates trend with signal combination from RSI.
- MACD: Main indicator of Elliot targets script, with option Histogram highest or lowest
in a week, a month, quarter, year depending on timeframe H1, H4 or Daily... I will show with pictures following photo.
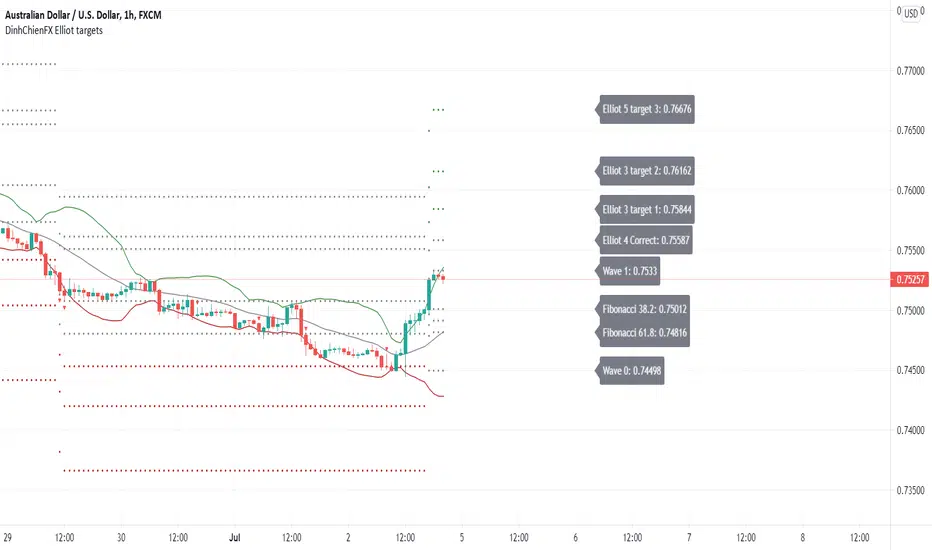
- Label: Option to display the price notice board:
1 - Main bulletins board (default: off): showing all prices at Fibonacci levels (38.2, 50, 61.8, 161.8, 200, 261.8).
2 - Separate bulletin board for 2 trends (up - down): current price at Fibonacci levels (38.2, 50, 61.8, 161.8, 200, 261.8).
- Generate Alerts: 1. Uptrend triggered. 2. Downtrend activated.
Here are a few examples of how the editor uses the above indicators to predict goals:
- The signal is with only MACD:

- The signals combine MACD and Bollinger Band:

- The signals combine MACD and RSI:

- The signals combine MACD + Bollinger band + RSI:

* The label shows:
- Main label is at Uptrend:

- Main label is at Downtrend:

- The separate labels is at Uptrend:

- The separate labels is at Downtrend:

I present my new Elliot targets script.
Anyone learning the Elliot wave is very difficult and difficult to understand.
I would like to take a few parts of the Elliot wave theory that is how to calculate the retracement area
and price levels according to the Fibonacci ratio of the Elliot wave. A Then combine the basic indicators Bollinger Band, MACD-H and RSI
to predict the future of the market. And try to automate the above.
The idea in the Elliot targets scenario is to combine:
+ Oscillators indicator (Rsi - Relative Strength Index)
+ Center Oscillators indicator (MACD - Moving Average convergence Divergence)
+ Volatility indicator (BB - Bollinger Band).
There are some option in the script, let see:
- Bollinger Band: calculates trend with signal combination from Bollinger Band indicator.
- RSI: calculates trend with signal combination from RSI.
- MACD: Main indicator of Elliot targets script, with option Histogram highest or lowest
in a week, a month, quarter, year depending on timeframe H1, H4 or Daily... I will show with pictures following photo.
- Label: Option to display the price notice board:
1 - Main bulletins board (default: off): showing all prices at Fibonacci levels (38.2, 50, 61.8, 161.8, 200, 261.8).
2 - Separate bulletin board for 2 trends (up - down): current price at Fibonacci levels (38.2, 50, 61.8, 161.8, 200, 261.8).
- Generate Alerts: 1. Uptrend triggered. 2. Downtrend activated.
Here are a few examples of how the editor uses the above indicators to predict goals:
- The signal is with only MACD:
- The signals combine MACD and Bollinger Band:
- The signals combine MACD and RSI:
- The signals combine MACD + Bollinger band + RSI:
* The label shows:
- Main label is at Uptrend:
- Main label is at Downtrend:
- The separate labels is at Uptrend:
- The separate labels is at Downtrend:
초대 전용 스크립트
이 스크립트는 작성자가 승인한 사용자만 접근할 수 있습니다. 사용하려면 요청 후 승인을 받아야 하며, 일반적으로 결제 후에 허가가 부여됩니다. 자세한 내용은 아래 작성자의 안내를 따르거나 dinhchien에게 직접 문의하세요.
트레이딩뷰는 스크립트의 작동 방식을 충분히 이해하고 작성자를 완전히 신뢰하지 않는 이상, 해당 스크립트에 비용을 지불하거나 사용하는 것을 권장하지 않습니다. 커뮤니티 스크립트에서 무료 오픈소스 대안을 찾아보실 수도 있습니다.
작성자 지시 사항
Use the link below to obtain access to this indicator
면책사항
해당 정보와 게시물은 금융, 투자, 트레이딩 또는 기타 유형의 조언이나 권장 사항으로 간주되지 않으며, 트레이딩뷰에서 제공하거나 보증하는 것이 아닙니다. 자세한 내용은 이용 약관을 참조하세요.