OPEN-SOURCE SCRIPT
BLITZ JUNK BOND INDICATOR
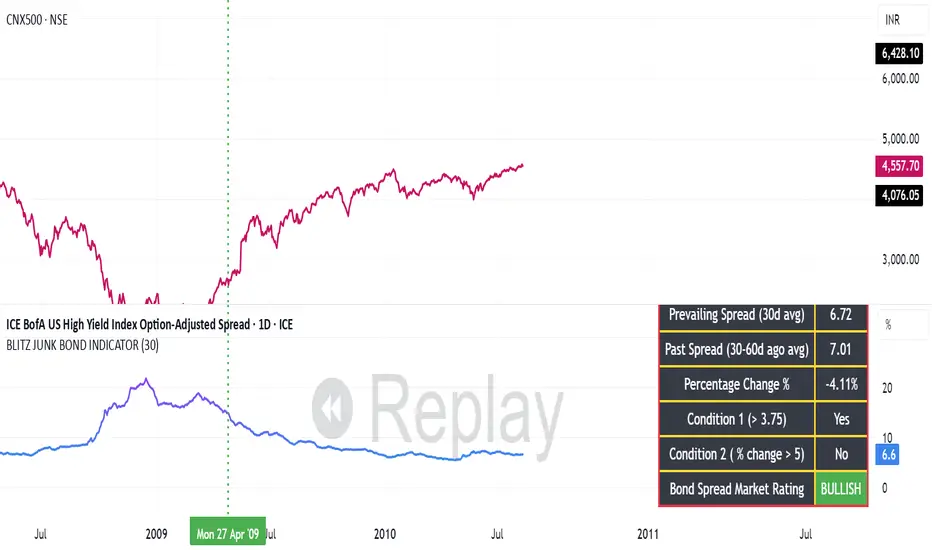
The given indicator considers the fluctuations in the bond market and the spread that are existing as a premium demanded by investors for high risk corporate junk bonds.
1. The junk bond spread indicator precisely anticipates market phases, especially any panic kind of scenario.
2. Junk bond spread indicator often face choppy market zone and entirely we must rely on our portfolio churning skills if such scenario occurs and the broader markets failed to perform even if the indicator has made us to make a buy position
3. Whenever Bullish signal comes, same is to be confirmed with the price action of the broader market index, then same to be confirmed in the junk bond spreads chart if the spreads are going down steadily or is breaking down from the nearest swing low and cooling off. This, scenario indicates we must expose our portfolio to equities
4. Whenever Bearish signal comes, same to be cofirmed with the price action of the broader market index, then same to be confirmed in the junk bond spread charts if the spreads are heating up breaking nearby swing highs or steadily moving up. In such scenario, we must prepare for heavy market drawdowns or must anticipate some panic scenario in the markets and thus should avoid equities.
오픈 소스 스크립트
트레이딩뷰의 진정한 정신에 따라, 이 스크립트의 작성자는 이를 오픈소스로 공개하여 트레이더들이 기능을 검토하고 검증할 수 있도록 했습니다. 작성자에게 찬사를 보냅니다! 이 코드는 무료로 사용할 수 있지만, 코드를 재게시하는 경우 하우스 룰이 적용된다는 점을 기억하세요.
면책사항
해당 정보와 게시물은 금융, 투자, 트레이딩 또는 기타 유형의 조언이나 권장 사항으로 간주되지 않으며, 트레이딩뷰에서 제공하거나 보증하는 것이 아닙니다. 자세한 내용은 이용 약관을 참조하세요.
오픈 소스 스크립트
트레이딩뷰의 진정한 정신에 따라, 이 스크립트의 작성자는 이를 오픈소스로 공개하여 트레이더들이 기능을 검토하고 검증할 수 있도록 했습니다. 작성자에게 찬사를 보냅니다! 이 코드는 무료로 사용할 수 있지만, 코드를 재게시하는 경우 하우스 룰이 적용된다는 점을 기억하세요.
면책사항
해당 정보와 게시물은 금융, 투자, 트레이딩 또는 기타 유형의 조언이나 권장 사항으로 간주되지 않으며, 트레이딩뷰에서 제공하거나 보증하는 것이 아닙니다. 자세한 내용은 이용 약관을 참조하세요.