PROTECTED SOURCE SCRIPT
업데이트됨 Stochastic cross up/dn calculator (Picte)
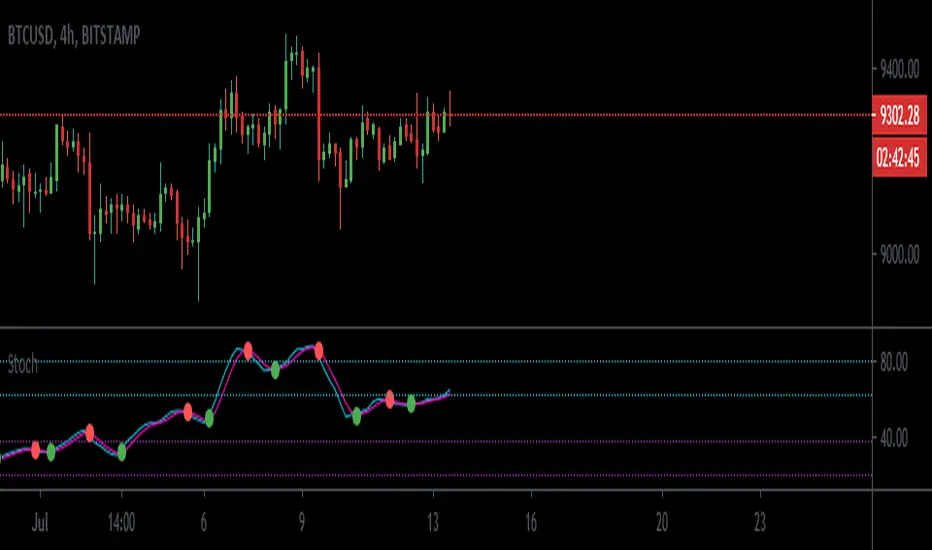
This indicator will calculate the estimated price needed for the stochastic oscillator to change direction. I also included some important horizontal levels for the oscillator. When the oscillator is stuck under the upper purple horizontal we are generally bearish and when it is stuck above the lower blue horizontal we are generally bullish.
The way i like to trade with this oscillator is to see it break a particular support/resistance line and buy/sell it on a retest. I will include some photos of signals i like to take with this indicator below.
I found it useful in the Forex market and also with bitcoin. The traditional market has yet to be tested. I would recommend it being used on time frames above the hourly. It does not mean that lower time frames can not work it is just that higher time frames offer better risk/reward ratio.
signal examples:

ENJOY :)
The way i like to trade with this oscillator is to see it break a particular support/resistance line and buy/sell it on a retest. I will include some photos of signals i like to take with this indicator below.
I found it useful in the Forex market and also with bitcoin. The traditional market has yet to be tested. I would recommend it being used on time frames above the hourly. It does not mean that lower time frames can not work it is just that higher time frames offer better risk/reward ratio.
signal examples:
ENJOY :)
릴리즈 노트
crosses marked보호된 스크립트입니다
이 스크립트는 비공개 소스로 게시됩니다. 하지만 이를 자유롭게 제한 없이 사용할 수 있습니다 – 자세한 내용은 여기에서 확인하세요.
면책사항
해당 정보와 게시물은 금융, 투자, 트레이딩 또는 기타 유형의 조언이나 권장 사항으로 간주되지 않으며, 트레이딩뷰에서 제공하거나 보증하는 것이 아닙니다. 자세한 내용은 이용 약관을 참조하세요.
면책사항
해당 정보와 게시물은 금융, 투자, 트레이딩 또는 기타 유형의 조언이나 권장 사항으로 간주되지 않으며, 트레이딩뷰에서 제공하거나 보증하는 것이 아닙니다. 자세한 내용은 이용 약관을 참조하세요.