PROTECTED SOURCE SCRIPT
업데이트됨 Support Resistance IV Finder

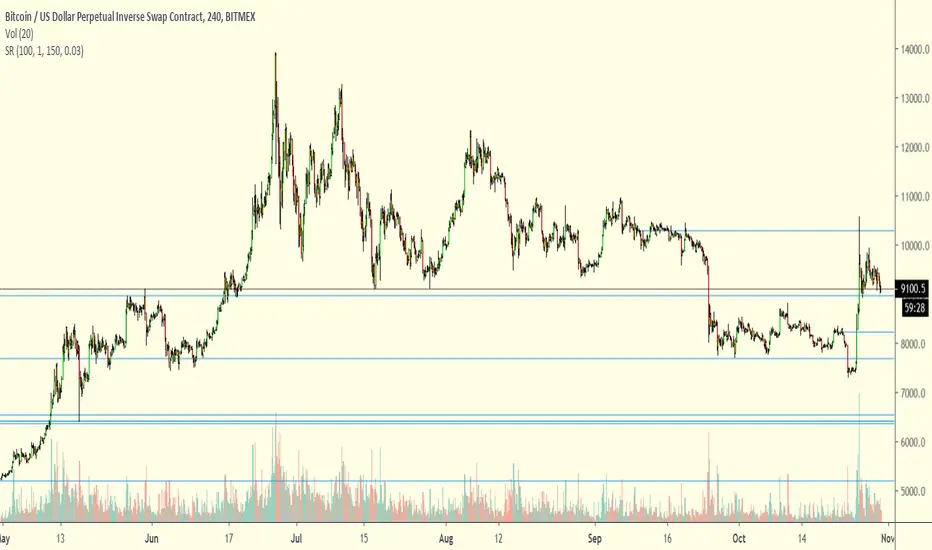
Useful to find Support/Resistance levels in chop markets.
Developed on 15min BTCUSD chart
On different timeframes/trading pairs it must be used and tweaked with EMA Slope and Inverse Volatility for optimal results
Scroll back on the chart to load older lines
Developed on 15min BTCUSD chart
On different timeframes/trading pairs it must be used and tweaked with EMA Slope and Inverse Volatility for optimal results
Scroll back on the chart to load older lines
릴리즈 노트
Useful to find Support/Resistance levels in chop markets.Developed on 15min BTCUSD chart
On different timeframes/trading pairs it must be used and tweaked with EMA Slope and Inverse Volatility for optimal results
Scroll back on the chart to load older lines
The lines are filtered by half the EMA range (0.5%) to not clutter the chart
릴리즈 노트
Automatically adapts to the following timeframes:30 min
45 min
1 hr (not so well)
4 hr
daily
Tested on BTCUSD
The use of Inverse Volatility and EMA slope is no longer needed in most situations
보호된 스크립트입니다
이 스크립트는 비공개 소스로 게시됩니다. 하지만 이를 자유롭게 제한 없이 사용할 수 있습니다 – 자세한 내용은 여기에서 확인하세요.
면책사항
해당 정보와 게시물은 금융, 투자, 트레이딩 또는 기타 유형의 조언이나 권장 사항으로 간주되지 않으며, 트레이딩뷰에서 제공하거나 보증하는 것이 아닙니다. 자세한 내용은 이용 약관을 참조하세요.
보호된 스크립트입니다
이 스크립트는 비공개 소스로 게시됩니다. 하지만 이를 자유롭게 제한 없이 사용할 수 있습니다 – 자세한 내용은 여기에서 확인하세요.
면책사항
해당 정보와 게시물은 금융, 투자, 트레이딩 또는 기타 유형의 조언이나 권장 사항으로 간주되지 않으며, 트레이딩뷰에서 제공하거나 보증하는 것이 아닙니다. 자세한 내용은 이용 약관을 참조하세요.