OPEN-SOURCE SCRIPT
4Hour Zone Separator
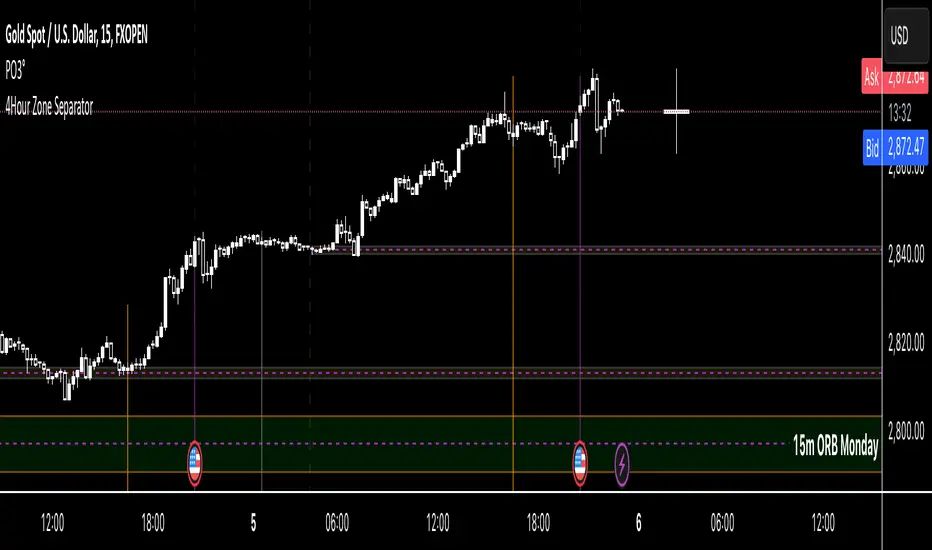
This custom TradingView indicator draws vertical lines on your chart to visually separate the 4-hour trading zones within a single trading day. The indicator helps traders identify key time intervals throughout the day for better market analysis and decision-making.
Features:
• Time-Based Zones: The indicator divides the day into six distinct 4-hour periods, starting from midnight (00:00) and continuing every 4 hours. Each zone is marked by a vertical line on the chart.
• User Customization: You can toggle the visibility of the lines for each 4-hour period (00:00, 04:00, 08:00, 12:00, 16:00, 20:00) based on your preference. This allows you to focus on specific zones that matter most for your analysis.
• Line Styling Options: Choose from three different line styles — Solid, Dashed, or Dotted — and adjust the thickness to your desired preference.
• Dynamic Time Adjustment: The indicator automatically adjusts for the time zone, ensuring that the 00:00 timestamp reflects the correct start of the day based on your chart’s time zone.
How It Works:
1. The indicator starts by calculating the beginning of the day at 00:00, then it sequentially places vertical lines every 4 hours.
2. Each line is color-coded for easy identification, and the lines stretch from the highest to the lowest point on the chart for that range.
3. The lines are drawn only when the chart enters a new 4-hour zone.
This tool is especially useful for day traders who want to track price action during specific times of the day and make informed decisions based on market behavior within each 4-hour period.
오픈 소스 스크립트
트레이딩뷰의 진정한 정신에 따라, 이 스크립트의 작성자는 이를 오픈소스로 공개하여 트레이더들이 기능을 검토하고 검증할 수 있도록 했습니다. 작성자에게 찬사를 보냅니다! 이 코드는 무료로 사용할 수 있지만, 코드를 재게시하는 경우 하우스 룰이 적용된다는 점을 기억하세요.
면책사항
해당 정보와 게시물은 금융, 투자, 트레이딩 또는 기타 유형의 조언이나 권장 사항으로 간주되지 않으며, 트레이딩뷰에서 제공하거나 보증하는 것이 아닙니다. 자세한 내용은 이용 약관을 참조하세요.
오픈 소스 스크립트
트레이딩뷰의 진정한 정신에 따라, 이 스크립트의 작성자는 이를 오픈소스로 공개하여 트레이더들이 기능을 검토하고 검증할 수 있도록 했습니다. 작성자에게 찬사를 보냅니다! 이 코드는 무료로 사용할 수 있지만, 코드를 재게시하는 경우 하우스 룰이 적용된다는 점을 기억하세요.
면책사항
해당 정보와 게시물은 금융, 투자, 트레이딩 또는 기타 유형의 조언이나 권장 사항으로 간주되지 않으며, 트레이딩뷰에서 제공하거나 보증하는 것이 아닙니다. 자세한 내용은 이용 약관을 참조하세요.