PROTECTED SOURCE SCRIPT
Spot Overlapping FVG - [FNDSFT]
🧠 Overview
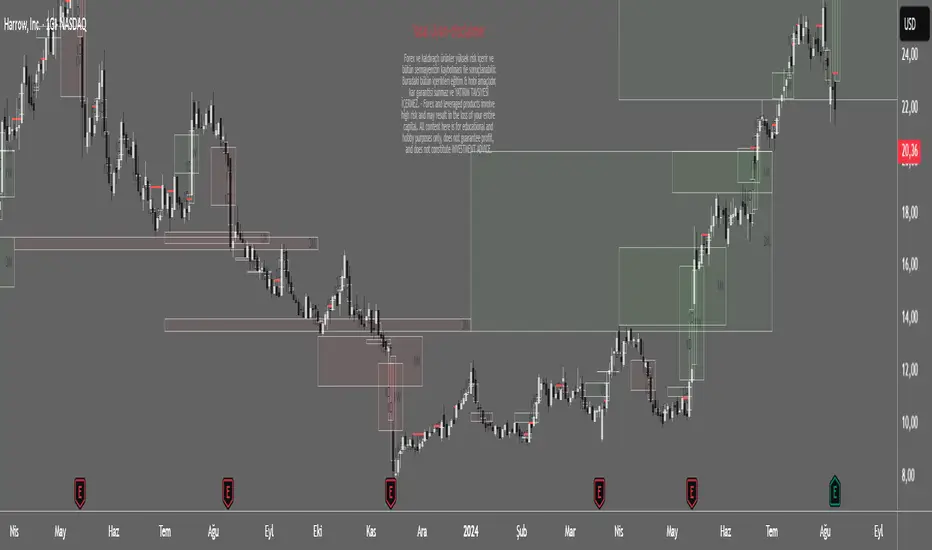
This script plots Higher Timeframe Fair Value Gaps (FVGs) with full visibility and precise placement on lower timeframe charts. Each timeframe (1D–12M) has its own independent toggle, custom label, and box styling, allowing traders to analyze broader market structures across swing and long-term horizons.
🎯 Features
✅ Identifies Fair Value Gaps using a 3-candle logic (candle 1 high vs candle 3 low, and vice versa).
✅ Plots HTF FVG boxes aligned to lower timeframes for comprehensive multi-timeframe analysis.
✅ Supports custom timeframes: 1D to 12M, with individual toggles.
✅ Full visual customization: border color, bullish/bearish box opacity, label font size and color.
✅ Modular inputs to enable or disable specific timeframes for performance.
✅ Uses barstate.isconfirmed logic for stable, non-repainting plots.
⚙️ How It Works
The script requests higher timeframe data via request.security. For each confirmed bar, it checks for FVGs based on:
Bullish FVG: low >= high[2]
Bearish FVG: low[2] >= high
If a gap is detected, a box is plotted between candle 1 and candle 3 using box.new().
Timeframe toggles ensure calculations remain within the limit of 40 request.security calls.
📈 Use Cases
Swing traders analyzing daily to monthly imbalances for medium-term strategies.
Position traders seeking to identify long-term imbalance zones for entries or exits.
ICT methodology practitioners visualizing higher timeframe displacement and inefficiencies.
Traders layering multiple HTF FVGs to build confluence-based trading decisions.
보호된 스크립트입니다
이 스크립트는 비공개 소스로 게시됩니다. 하지만 이를 자유롭게 제한 없이 사용할 수 있습니다 – 자세한 내용은 여기에서 확인하세요.
면책사항
해당 정보와 게시물은 금융, 투자, 트레이딩 또는 기타 유형의 조언이나 권장 사항으로 간주되지 않으며, 트레이딩뷰에서 제공하거나 보증하는 것이 아닙니다. 자세한 내용은 이용 약관을 참조하세요.
면책사항
해당 정보와 게시물은 금융, 투자, 트레이딩 또는 기타 유형의 조언이나 권장 사항으로 간주되지 않으며, 트레이딩뷰에서 제공하거나 보증하는 것이 아닙니다. 자세한 내용은 이용 약관을 참조하세요.