PROTECTED SOURCE SCRIPT
업데이트됨 Market Profile
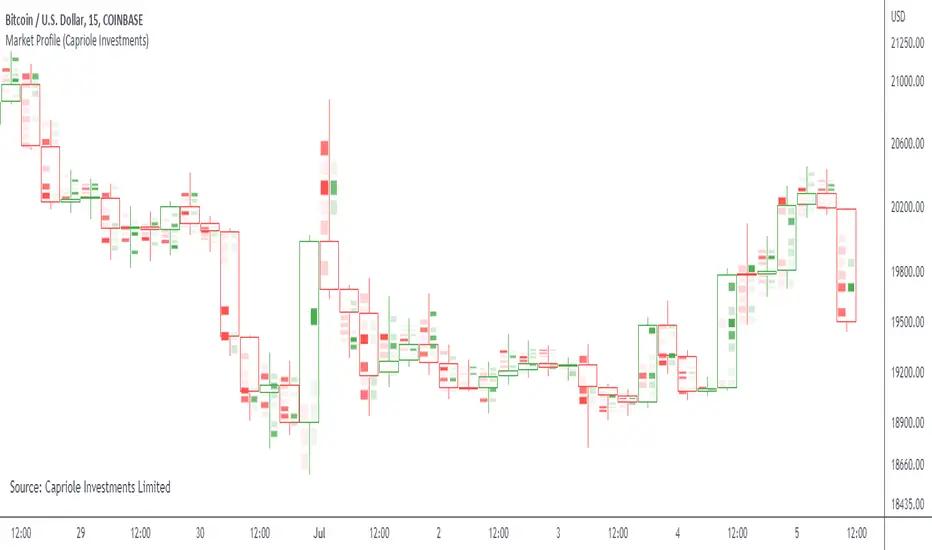
Simple "Market Profile" script to help visualize where high volume nodes are occurring on higher-time frame candles.
Historical lookback is visually limited based on the number of candles TradingView provides on the chosen timeframe.
The script calculates the buy/sell pressure on the timeframe chosen, and aggregates volume up to the higher timeframe of choice (default: 4hr).
The volume for each candle is then normalized to assess how many standard deviations away from the mean it is. The color gradient on the chart is stronger for readings with more extreme z-scores.
Readings which are less than 2-standard deviations from the mean are not colored (white) - making it easier to visualize where the extremities of volume occur only.
Recommend using on default settings, on the 5-min of 15-min chart. Then hide the normal price data by clicking the "eye" symbol.
If you want to visualize historic periods, you can change the lookback settings.
릴리즈 노트
Sourcing update보호된 스크립트입니다
이 스크립트는 비공개 소스로 게시됩니다. 하지만 이를 자유롭게 제한 없이 사용할 수 있습니다 – 자세한 내용은 여기에서 확인하세요.
면책사항
해당 정보와 게시물은 금융, 투자, 트레이딩 또는 기타 유형의 조언이나 권장 사항으로 간주되지 않으며, 트레이딩뷰에서 제공하거나 보증하는 것이 아닙니다. 자세한 내용은 이용 약관을 참조하세요.
보호된 스크립트입니다
이 스크립트는 비공개 소스로 게시됩니다. 하지만 이를 자유롭게 제한 없이 사용할 수 있습니다 – 자세한 내용은 여기에서 확인하세요.
면책사항
해당 정보와 게시물은 금융, 투자, 트레이딩 또는 기타 유형의 조언이나 권장 사항으로 간주되지 않으며, 트레이딩뷰에서 제공하거나 보증하는 것이 아닙니다. 자세한 내용은 이용 약관을 참조하세요.