PROTECTED SOURCE SCRIPT
[DEM] Donchian Channels Bars
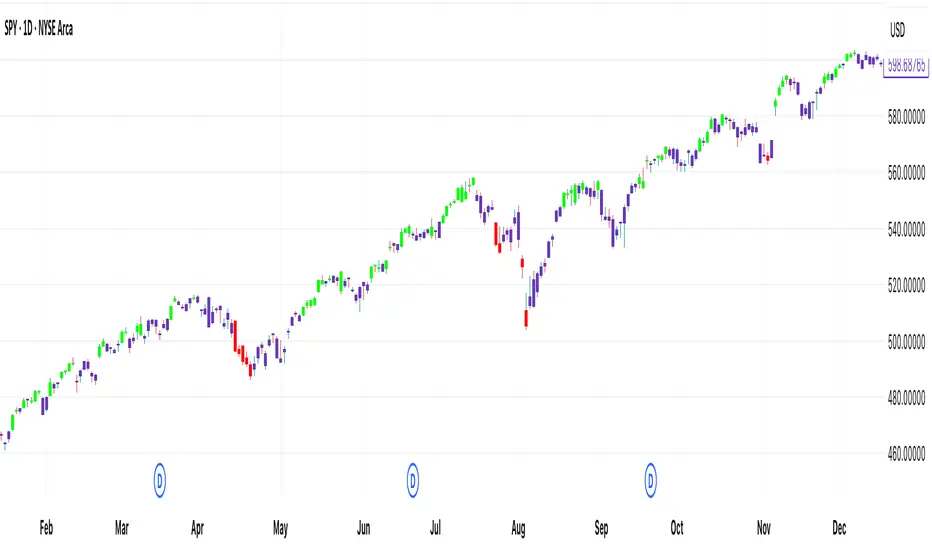
[DEM] Donchian Channels Bars is designed to color-code price bars based on their relationship to Donchian Channel breakouts by comparing short-term and long-term highest high and lowest low levels. The indicator uses two configurable lookback periods (default 1 and 20 bars) and colors bars green when the shorter-period highest high equals the longer-period highest high (indicating an upward breakout or new high), red when the shorter-period lowest low equals the longer-period lowest low (indicating a downward breakout or new low), and purple when neither condition is met. This visual system helps traders quickly identify when price is making significant moves beyond established ranges, with green bars highlighting potential bullish breakouts above recent resistance and red bars highlighting potential bearish breakouts below recent support levels.
보호된 스크립트입니다
이 스크립트는 비공개 소스로 게시됩니다. 하지만 이를 자유롭게 제한 없이 사용할 수 있습니다 – 자세한 내용은 여기에서 확인하세요.
면책사항
해당 정보와 게시물은 금융, 투자, 트레이딩 또는 기타 유형의 조언이나 권장 사항으로 간주되지 않으며, 트레이딩뷰에서 제공하거나 보증하는 것이 아닙니다. 자세한 내용은 이용 약관을 참조하세요.
보호된 스크립트입니다
이 스크립트는 비공개 소스로 게시됩니다. 하지만 이를 자유롭게 제한 없이 사용할 수 있습니다 – 자세한 내용은 여기에서 확인하세요.
면책사항
해당 정보와 게시물은 금융, 투자, 트레이딩 또는 기타 유형의 조언이나 권장 사항으로 간주되지 않으며, 트레이딩뷰에서 제공하거나 보증하는 것이 아닙니다. 자세한 내용은 이용 약관을 참조하세요.