OPEN-SOURCE SCRIPT
Range + Breakout/Breakdown + Box [Sharad] v5
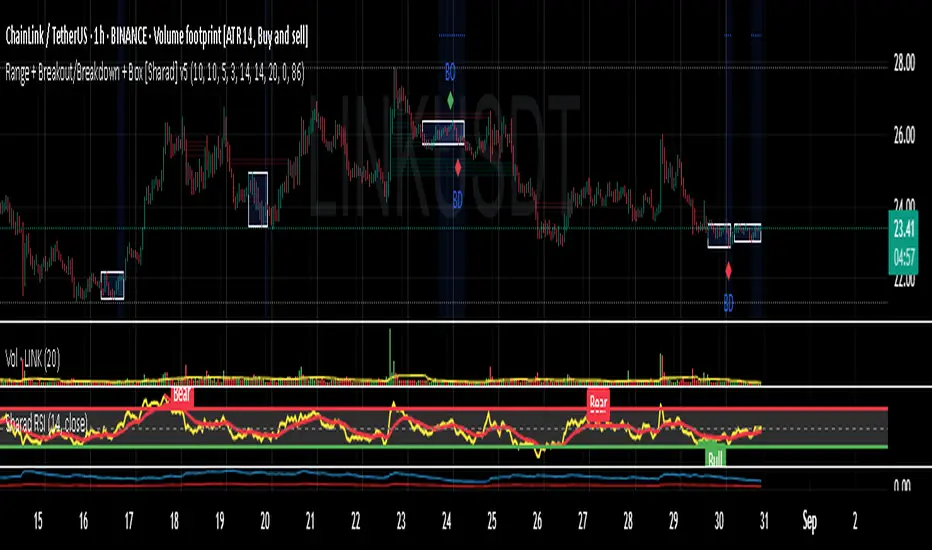
🔷 Range + Breakout/Breakdown + Box [Sharad]
This indicator is designed to detect consolidation ranges and highlight potential breakouts (up) or breakdowns (down) when price escapes those ranges.
It automatically draws a rectangle box over the detected range, making it easier to visualize sideways price action and potential coil patterns.
✨ Features
Detects range conditions based on:
Range width (as % of price and/or relative to ATR).
Consecutive bar count inside range.
Optional ADX filter for trend strength.
Highlights Breakout Up and Breakdown Down with on-chart markers.
Draws a box around the range that persists until the range ends.
Built-in TradingView alerts:
Range Detected
Breakout Up
Breakdown Down
Customizable inputs for sensitivity, buffer, and visualization.
⚠️ Warnings & Disclaimer
This tool is for educational and research purposes only.
It does NOT provide financial advice, trade recommendations, or guaranteed results.
Market conditions can invalidate signals; false breakouts are common.
Always backtest before using in live trading.
Use strict risk management (stop-loss, position sizing, risk–reward planning).
You are fully responsible for any trades taken using this indicator.
👉 Use at your own risk. Neither the author nor TradingView accepts liability for financial loss or damages.
오픈 소스 스크립트
진정한 트레이딩뷰 정신에 따라 이 스크립트 작성자는 트레이더가 기능을 검토하고 검증할 수 있도록 오픈소스로 공개했습니다. 작성자에게 찬사를 보냅니다! 무료로 사용할 수 있지만 코드를 다시 게시할 경우 하우스 룰이 적용된다는 점을 기억하세요.
면책사항
이 정보와 게시물은 TradingView에서 제공하거나 보증하는 금융, 투자, 거래 또는 기타 유형의 조언이나 권고 사항을 의미하거나 구성하지 않습니다. 자세한 내용은 이용 약관을 참고하세요.
오픈 소스 스크립트
진정한 트레이딩뷰 정신에 따라 이 스크립트 작성자는 트레이더가 기능을 검토하고 검증할 수 있도록 오픈소스로 공개했습니다. 작성자에게 찬사를 보냅니다! 무료로 사용할 수 있지만 코드를 다시 게시할 경우 하우스 룰이 적용된다는 점을 기억하세요.
면책사항
이 정보와 게시물은 TradingView에서 제공하거나 보증하는 금융, 투자, 거래 또는 기타 유형의 조언이나 권고 사항을 의미하거나 구성하지 않습니다. 자세한 내용은 이용 약관을 참고하세요.