OPEN-SOURCE SCRIPT
MACD Hybrid BSH
MACD = Moving Average Convergence and Divergence
Hybrid = Combining the two main MACD signals into one indicator
BSH = Buy Sell Hold
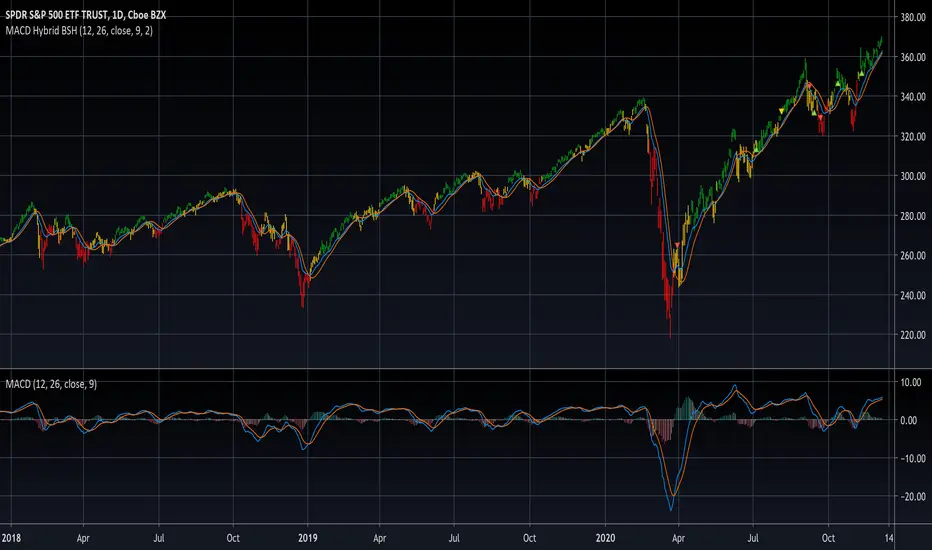
This indicator looks for a crossover of the MACD moving averages (12ema and 26ema) in order to generate a buy/sell signal and a crossover of the MACD line (12ema minus 26ema) and MACD signal line (9ema of MACD line) in order to generate a completely seperate buy/sell signal. The two buy/sell signals are combined into a hybrid buy/sell/hold indicator which looks for one, neither, or both signals to be "buys." If both signals are buys (fast crossed above slow), a "buy" signal is given (green bar color). If only one signal is a buy, a "hold" signal is given (yellow bar color). If neither signal is a buy, a "sell" signal is given (red bar color). Note: MACD moving averages crossing over is the same thing as the MACD line crossing the zero level in the MACD indicator.
It makes sense to have the MACD indicator loaded as a reference when using this but it isn't required. The lines plotted on the chart are the 12ema and a signal line which is the MACD signal line shown relative to the 12ema rather than the MACD line. The 26ema is not plotted on the chart because the chart becomes cluttered, plus the moving averages crossing over is indicated with the MACD indicator.
This indicator should be used with other indicators such as ATR (1), RSI (14), Bollinger bands (20, 2), etc. in order to determine the best course of action when a signal is given. One way to use this as a strict system is to take a neutral cash position when a yellow "hold" signal is given, to go long when a
green "buy" signal is given, and to go short when a red "sell" signal is given. It can be observed that for many tickers and timeframes that green-yellow-green and red-yellow-red sequences are stronger signals than green-yellow-red and red-yellow-green signals.
Note: Chart type must be "bars" in order for the bar colorization to work properly
Hybrid = Combining the two main MACD signals into one indicator
BSH = Buy Sell Hold
This indicator looks for a crossover of the MACD moving averages (12ema and 26ema) in order to generate a buy/sell signal and a crossover of the MACD line (12ema minus 26ema) and MACD signal line (9ema of MACD line) in order to generate a completely seperate buy/sell signal. The two buy/sell signals are combined into a hybrid buy/sell/hold indicator which looks for one, neither, or both signals to be "buys." If both signals are buys (fast crossed above slow), a "buy" signal is given (green bar color). If only one signal is a buy, a "hold" signal is given (yellow bar color). If neither signal is a buy, a "sell" signal is given (red bar color). Note: MACD moving averages crossing over is the same thing as the MACD line crossing the zero level in the MACD indicator.
It makes sense to have the MACD indicator loaded as a reference when using this but it isn't required. The lines plotted on the chart are the 12ema and a signal line which is the MACD signal line shown relative to the 12ema rather than the MACD line. The 26ema is not plotted on the chart because the chart becomes cluttered, plus the moving averages crossing over is indicated with the MACD indicator.
This indicator should be used with other indicators such as ATR (1), RSI (14), Bollinger bands (20, 2), etc. in order to determine the best course of action when a signal is given. One way to use this as a strict system is to take a neutral cash position when a yellow "hold" signal is given, to go long when a
green "buy" signal is given, and to go short when a red "sell" signal is given. It can be observed that for many tickers and timeframes that green-yellow-green and red-yellow-red sequences are stronger signals than green-yellow-red and red-yellow-green signals.
Note: Chart type must be "bars" in order for the bar colorization to work properly
오픈 소스 스크립트
트레이딩뷰의 진정한 정신에 따라, 이 스크립트의 작성자는 이를 오픈소스로 공개하여 트레이더들이 기능을 검토하고 검증할 수 있도록 했습니다. 작성자에게 찬사를 보냅니다! 이 코드는 무료로 사용할 수 있지만, 코드를 재게시하는 경우 하우스 룰이 적용된다는 점을 기억하세요.
면책사항
해당 정보와 게시물은 금융, 투자, 트레이딩 또는 기타 유형의 조언이나 권장 사항으로 간주되지 않으며, 트레이딩뷰에서 제공하거나 보증하는 것이 아닙니다. 자세한 내용은 이용 약관을 참조하세요.
오픈 소스 스크립트
트레이딩뷰의 진정한 정신에 따라, 이 스크립트의 작성자는 이를 오픈소스로 공개하여 트레이더들이 기능을 검토하고 검증할 수 있도록 했습니다. 작성자에게 찬사를 보냅니다! 이 코드는 무료로 사용할 수 있지만, 코드를 재게시하는 경우 하우스 룰이 적용된다는 점을 기억하세요.
면책사항
해당 정보와 게시물은 금융, 투자, 트레이딩 또는 기타 유형의 조언이나 권장 사항으로 간주되지 않으며, 트레이딩뷰에서 제공하거나 보증하는 것이 아닙니다. 자세한 내용은 이용 약관을 참조하세요.