OPEN-SOURCE SCRIPT
Critical Levels Mixing Price Action, Volatility and Volume
Introduction
This indicator has the purpose of setting levels, automatically, basing its creation on three aspects of the market:
- price action
- volume
- volatility
Price Action Algorithm
I divided the candle into 3 parts:
- body => abs (close-open)
- lower tail => red candle (close-low) green candle (open-low)
- upper tail => red candle (high-open) green candle (high-close)
- total => high-low
to give the signal the following conditions must be respected
- the body must be smaller than a certain percentage ("MAX CORE SIZE%) and larger than a certain percentage (" MIN CORE SIZE%);
- furthermore, the shorter tail cannot be higher than a certain percentage ("MAXIMUM LENGTH FOR SHORTE TAIL%");
Volume Algorithm
The volume value must be greater than the volume EMA multiplied by a certain value ("Multiplier")
Volatility Algorithm
the True Range of the candle must be greater than the "ATR percentage" of the ATR
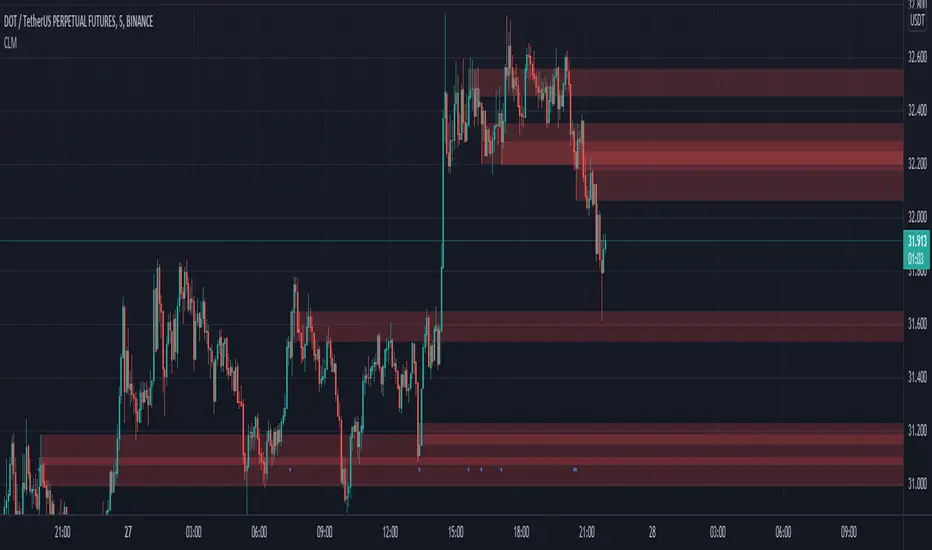
Trigger
If all these three conditions are met then and only then will the level be drawn that will include the prices of the longest tail of the candle (high/open or open/low or high/close or close/low).
How to use
Like any level, the situation in which the price is reached does not imply a market reaction, for this reason, the use together with moving averages or oscillators from which to extrapolate the divergences can be a valid tool.
Using this indicator alone you can enter the market by placing a pending order above the high or low of the candle touching the level.
Example:
a bearish candle touches a low level, we place a pending buy order above the high of the candle
a bullish candle touches a level located high, we place a pending sell order below the low of the candle
This indicator has the purpose of setting levels, automatically, basing its creation on three aspects of the market:
- price action
- volume
- volatility
Price Action Algorithm
I divided the candle into 3 parts:
- body => abs (close-open)
- lower tail => red candle (close-low) green candle (open-low)
- upper tail => red candle (high-open) green candle (high-close)
- total => high-low
to give the signal the following conditions must be respected
- the body must be smaller than a certain percentage ("MAX CORE SIZE%) and larger than a certain percentage (" MIN CORE SIZE%);
- furthermore, the shorter tail cannot be higher than a certain percentage ("MAXIMUM LENGTH FOR SHORTE TAIL%");
Volume Algorithm
The volume value must be greater than the volume EMA multiplied by a certain value ("Multiplier")
Volatility Algorithm
the True Range of the candle must be greater than the "ATR percentage" of the ATR
Trigger
If all these three conditions are met then and only then will the level be drawn that will include the prices of the longest tail of the candle (high/open or open/low or high/close or close/low).
How to use
Like any level, the situation in which the price is reached does not imply a market reaction, for this reason, the use together with moving averages or oscillators from which to extrapolate the divergences can be a valid tool.
Using this indicator alone you can enter the market by placing a pending order above the high or low of the candle touching the level.
Example:
a bearish candle touches a low level, we place a pending buy order above the high of the candle
a bullish candle touches a level located high, we place a pending sell order below the low of the candle
오픈 소스 스크립트
트레이딩뷰의 진정한 정신에 따라, 이 스크립트의 작성자는 이를 오픈소스로 공개하여 트레이더들이 기능을 검토하고 검증할 수 있도록 했습니다. 작성자에게 찬사를 보냅니다! 이 코드는 무료로 사용할 수 있지만, 코드를 재게시하는 경우 하우스 룰이 적용된다는 점을 기억하세요.
면책사항
해당 정보와 게시물은 금융, 투자, 트레이딩 또는 기타 유형의 조언이나 권장 사항으로 간주되지 않으며, 트레이딩뷰에서 제공하거나 보증하는 것이 아닙니다. 자세한 내용은 이용 약관을 참조하세요.
오픈 소스 스크립트
트레이딩뷰의 진정한 정신에 따라, 이 스크립트의 작성자는 이를 오픈소스로 공개하여 트레이더들이 기능을 검토하고 검증할 수 있도록 했습니다. 작성자에게 찬사를 보냅니다! 이 코드는 무료로 사용할 수 있지만, 코드를 재게시하는 경우 하우스 룰이 적용된다는 점을 기억하세요.
면책사항
해당 정보와 게시물은 금융, 투자, 트레이딩 또는 기타 유형의 조언이나 권장 사항으로 간주되지 않으며, 트레이딩뷰에서 제공하거나 보증하는 것이 아닙니다. 자세한 내용은 이용 약관을 참조하세요.