OPEN-SOURCE SCRIPT
업데이트됨 Candle Sequence
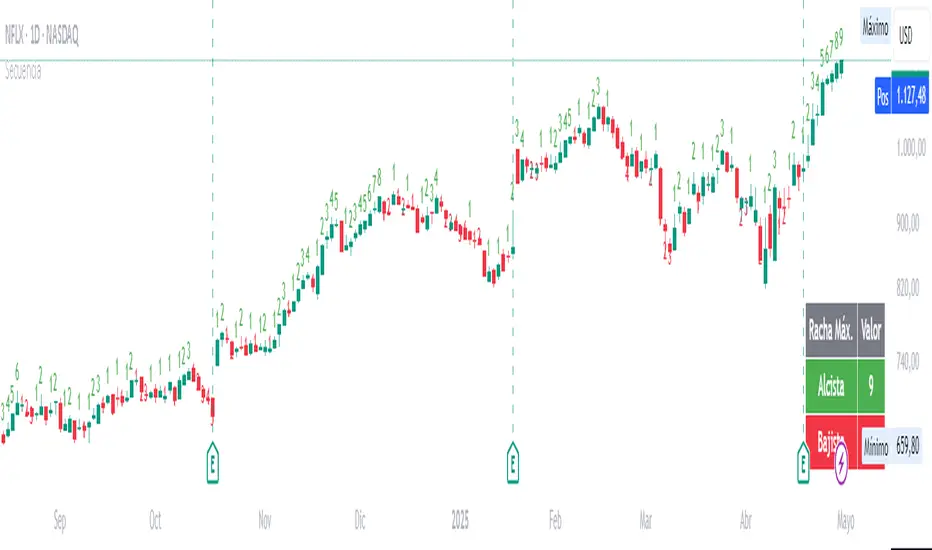
Looking to easily identify moments of strong market conviction? "Racha Velas" (or your chosen English name like "Consecutive Candles Streak") allows you to visualize clearly and directly sequences of consecutive bullish and bearish candles.
**Key Features:**
* **Real-time Counting:** Displays the number of consecutive candles directly on the chart.
* **Visual Customization:** Adjust the text size and color for optimal visualization.
* **Vertical Offset:** Control the position of the counter to avoid obstructions.
* **Maximum Streaks Table (Optional):** Visualize the largest bullish and bearish streaks found in the chart's history, useful for understanding volatility and price behavior.
* **Easy to Use:** Simply add the indicator to your chart and start analyzing.
This indicator is a valuable tool for traders looking to confirm trends, identify potential exhaustion points, or simply understand price dynamics at a glance. Give it a try and discover the market's streaks!
*****************************************************************************************************
¿Buscas identificar momentos de fuerte convicción del mercado? "Racha Velas" te permite visualizar de forma clara y directa las secuencias de velas consecutivas alcistas y bajistas.
**Características principales:**
* **Conteo en Tiempo Real:** Muestra el número de velas consecutivas directamente en el gráfico.
* **Personalización Visual:** Ajusta el tamaño y color del texto para una visualización óptima.
* **Offset Vertical:** Controla la posición del contador para evitar obstrucciones.
* **Tabla de Rachas Máximas (Opcional):** Visualiza las mayores rachas alcistas y bajistas encontradas en el historial del gráfico, útil para entender la volatilidad y el comportamiento del precio.
* **Fácil de Usar:** Simplemente añade el indicador a tu gráfico y comienza a analizar.
Este indicador es una herramienta valiosa para traders que buscan confirmar tendencias, identificar posibles agotamientos o simplemente entender la dinámica del precio en un vistazo. ¡Pruébalo y descubre las rachas del mercado!
릴리즈 노트
Looking to easily identify moments of strong market conviction? "Racha Velas" (or your chosen English name like "Consecutive Candles Streak") allows you to visualize clearly and directly sequences of consecutive bullish and bearish candles.**Key Features:**
* **Real-time Counting:** Displays the number of consecutive candles directly on the chart.
* **Visual Customization:** Adjust the text size and color for optimal visualization.
* **Vertical Offset:** Control the position of the counter to avoid obstructions.
* **Maximum Streaks Table (Optional):** Visualize the largest bullish and bearish streaks found in the chart's history, useful for understanding volatility and price behavior.
* **Easy to Use:** Simply add the indicator to your chart and start analyzing.
This indicator is a valuable tool for traders looking to confirm trends, identify potential exhaustion points, or simply understand price dynamics at a glance. Give it a try and discover the market's streaks!
릴리즈 노트
Looking to easily identify moments of strong market conviction? Candle Sequence allows you to visualize clearly and directly sequences of consecutive bullish and bearish candles.**Key Features:**
* **Real-time Counting:** Displays the number of consecutive candles directly on the chart.
* **Visual Customization:** Adjust the text size and color for optimal visualization.
* **Vertical Offset:** Control the position of the counter to avoid obstructions.
* **Maximum Streaks Table (Optional):** Visualize the largest bullish and bearish streaks found in the chart's history, useful for understanding volatility and price behavior.
* **Easy to Use:** Simply add the indicator to your chart and start analyzing.
This indicator is a valuable tool for traders looking to confirm trends, identify potential exhaustion points, or simply understand price dynamics at a glance. Give it a try and discover the market's streaks!
릴리즈 노트
.오픈 소스 스크립트
트레이딩뷰의 진정한 정신에 따라, 이 스크립트의 작성자는 이를 오픈소스로 공개하여 트레이더들이 기능을 검토하고 검증할 수 있도록 했습니다. 작성자에게 찬사를 보냅니다! 이 코드는 무료로 사용할 수 있지만, 코드를 재게시하는 경우 하우스 룰이 적용된다는 점을 기억하세요.
면책사항
해당 정보와 게시물은 금융, 투자, 트레이딩 또는 기타 유형의 조언이나 권장 사항으로 간주되지 않으며, 트레이딩뷰에서 제공하거나 보증하는 것이 아닙니다. 자세한 내용은 이용 약관을 참조하세요.
오픈 소스 스크립트
트레이딩뷰의 진정한 정신에 따라, 이 스크립트의 작성자는 이를 오픈소스로 공개하여 트레이더들이 기능을 검토하고 검증할 수 있도록 했습니다. 작성자에게 찬사를 보냅니다! 이 코드는 무료로 사용할 수 있지만, 코드를 재게시하는 경우 하우스 룰이 적용된다는 점을 기억하세요.
면책사항
해당 정보와 게시물은 금융, 투자, 트레이딩 또는 기타 유형의 조언이나 권장 사항으로 간주되지 않으며, 트레이딩뷰에서 제공하거나 보증하는 것이 아닙니다. 자세한 내용은 이용 약관을 참조하세요.