OPEN-SOURCE SCRIPT
업데이트됨 Custom Signal Oscillator Strategy
The CSO is made to help traders easily test their theories by subtracting the difference between two customizable plots(indicators) without having to search for strategies. The general purpose is to provide a tool to users without coding knowledge.
How to use :
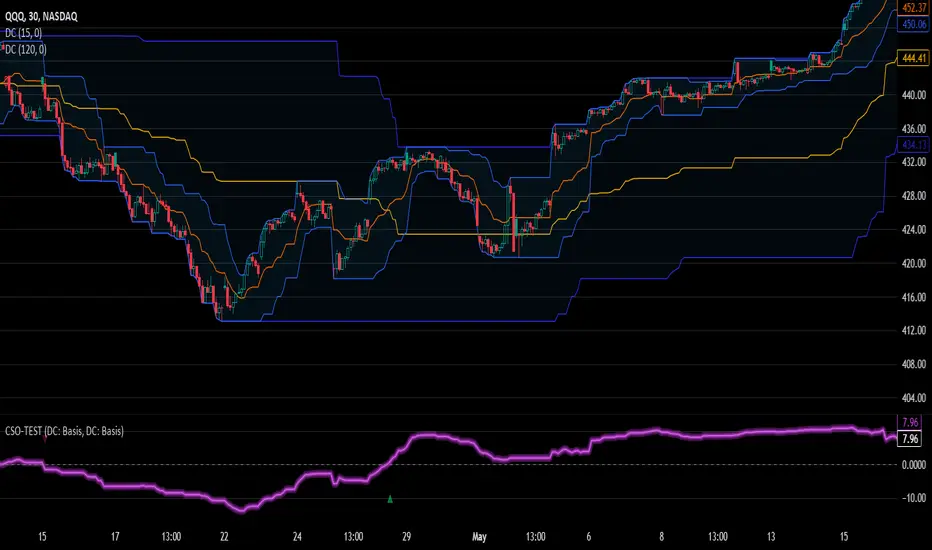
For example, the published strategy is using the basis lines from two Donchian channels with varying length. This can be utilized with multiple overlays on the chart and oscillators that are operating on the same scale with each other. Since chart glows aren't extremely common, a glow option is included to stand out on the chart as the chain operator. A long only option for is also included for versatility.
How to use :
- Apply the indicator(s) to test
- Go to the CSO strategy input settings and select the desired plots from the added indicators. (The back test will enter long or short depending on the fast signal crosses on the slow signal)
- Pull up the strategy tester
- Adjust the input settings on the selected indicator(s) to back test
For example, the published strategy is using the basis lines from two Donchian channels with varying length. This can be utilized with multiple overlays on the chart and oscillators that are operating on the same scale with each other. Since chart glows aren't extremely common, a glow option is included to stand out on the chart as the chain operator. A long only option for is also included for versatility.
릴리즈 노트
Alerts Added릴리즈 노트
V6 Update오픈 소스 스크립트
트레이딩뷰의 진정한 정신에 따라, 이 스크립트의 작성자는 이를 오픈소스로 공개하여 트레이더들이 기능을 검토하고 검증할 수 있도록 했습니다. 작성자에게 찬사를 보냅니다! 이 코드는 무료로 사용할 수 있지만, 코드를 재게시하는 경우 하우스 룰이 적용된다는 점을 기억하세요.
KP
면책사항
해당 정보와 게시물은 금융, 투자, 트레이딩 또는 기타 유형의 조언이나 권장 사항으로 간주되지 않으며, 트레이딩뷰에서 제공하거나 보증하는 것이 아닙니다. 자세한 내용은 이용 약관을 참조하세요.
오픈 소스 스크립트
트레이딩뷰의 진정한 정신에 따라, 이 스크립트의 작성자는 이를 오픈소스로 공개하여 트레이더들이 기능을 검토하고 검증할 수 있도록 했습니다. 작성자에게 찬사를 보냅니다! 이 코드는 무료로 사용할 수 있지만, 코드를 재게시하는 경우 하우스 룰이 적용된다는 점을 기억하세요.
KP
면책사항
해당 정보와 게시물은 금융, 투자, 트레이딩 또는 기타 유형의 조언이나 권장 사항으로 간주되지 않으며, 트레이딩뷰에서 제공하거나 보증하는 것이 아닙니다. 자세한 내용은 이용 약관을 참조하세요.