PROTECTED SOURCE SCRIPT
CNN Fear and Greed Index
📊 CNN Fear & Greed Index — by victhoreb
Tap into the emotional heartbeat of the U.S. stock market with this powerful CNN-inspired Fear & Greed Index! 🧠📉📈 Designed to mirror the sentiment framework popularized by CNN Business, this indicator blends 7 key market signals into a single score from 0 (😱 Extreme Fear) to 100 (🚀 Extreme Greed), helping you navigate volatility with confidence.
🧩 What’s Inside?
Each component captures a unique behavioral or macroeconomic force:
- ⚡ Market Momentum: Tracks how far the S&P 500 is from its 125-day average — a pulse check on trend strength.
- 🏛️ Stock Price Strength: Measures the NYSE Highs vs. Lows — are more stocks breaking out or breaking down?
- 🌊 Stock Price Breadth: Uses the McClellan Volume Summation Index to assess market-wide participation.
- ☎️ Put/Call Ratio: A 5-day average of the equity options market — are traders hedging or chasing?
- 🌪️ Volatility (VIX): Compares the VIX to its 50-day average — rising fear or calming nerves?
- 🛡️ Safe Haven Demand: Contrasts stock returns with bond returns — are investors seeking shelter or risk?
- 💣 Junk Bond Demand: Inverted high-yield spread — tighter spreads = more risk-on appetite.
🎯 Why Use It?
This index gives you a quantified view of Wall Street’s mood, helping you:
- Spot emotional extremes that often precede reversals
- Confirm or challenge your directional bias
- Stay grounded when the market gets irrational
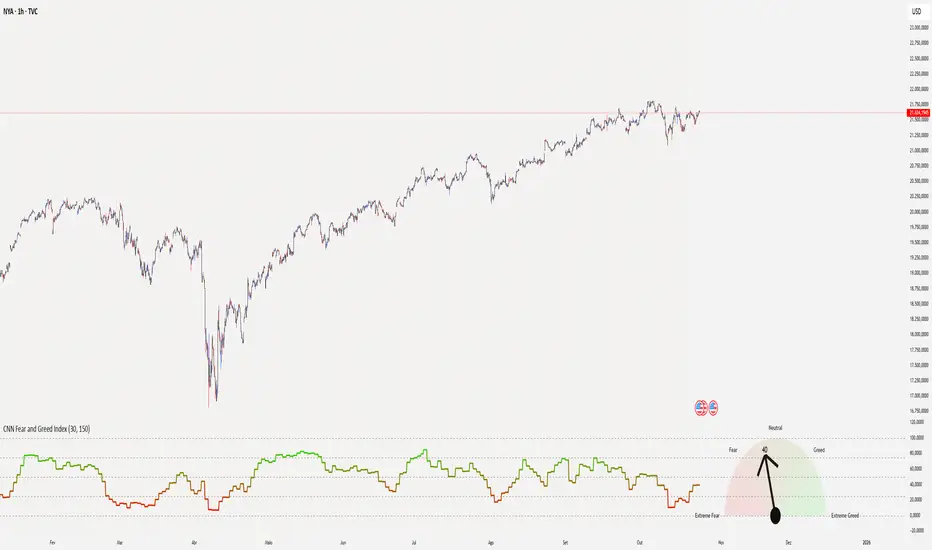
🧭 Visual Sentiment Meter
A custom offset sentiment meter shows current positioning with intuitive labels:
- 😱 Extreme Fear
- 😨 Fear
- 😐 Neutral
- 😄 Greed
- 🚀 Extreme Greed
Color gradients and dynamic labels make it easy to interpret at a glance.
Ready to trade with the crowd—or against it? Add this indicator to your chart and let sentiment guide your strategy! 📈🧠
Tap into the emotional heartbeat of the U.S. stock market with this powerful CNN-inspired Fear & Greed Index! 🧠📉📈 Designed to mirror the sentiment framework popularized by CNN Business, this indicator blends 7 key market signals into a single score from 0 (😱 Extreme Fear) to 100 (🚀 Extreme Greed), helping you navigate volatility with confidence.
🧩 What’s Inside?
Each component captures a unique behavioral or macroeconomic force:
- ⚡ Market Momentum: Tracks how far the S&P 500 is from its 125-day average — a pulse check on trend strength.
- 🏛️ Stock Price Strength: Measures the NYSE Highs vs. Lows — are more stocks breaking out or breaking down?
- 🌊 Stock Price Breadth: Uses the McClellan Volume Summation Index to assess market-wide participation.
- ☎️ Put/Call Ratio: A 5-day average of the equity options market — are traders hedging or chasing?
- 🌪️ Volatility (VIX): Compares the VIX to its 50-day average — rising fear or calming nerves?
- 🛡️ Safe Haven Demand: Contrasts stock returns with bond returns — are investors seeking shelter or risk?
- 💣 Junk Bond Demand: Inverted high-yield spread — tighter spreads = more risk-on appetite.
🎯 Why Use It?
This index gives you a quantified view of Wall Street’s mood, helping you:
- Spot emotional extremes that often precede reversals
- Confirm or challenge your directional bias
- Stay grounded when the market gets irrational
🧭 Visual Sentiment Meter
A custom offset sentiment meter shows current positioning with intuitive labels:
- 😱 Extreme Fear
- 😨 Fear
- 😐 Neutral
- 😄 Greed
- 🚀 Extreme Greed
Color gradients and dynamic labels make it easy to interpret at a glance.
Ready to trade with the crowd—or against it? Add this indicator to your chart and let sentiment guide your strategy! 📈🧠
보호된 스크립트입니다
이 스크립트는 비공개 소스로 게시됩니다. 하지만 이를 자유롭게 제한 없이 사용할 수 있습니다 – 자세한 내용은 여기에서 확인하세요.
면책사항
해당 정보와 게시물은 금융, 투자, 트레이딩 또는 기타 유형의 조언이나 권장 사항으로 간주되지 않으며, 트레이딩뷰에서 제공하거나 보증하는 것이 아닙니다. 자세한 내용은 이용 약관을 참조하세요.
면책사항
해당 정보와 게시물은 금융, 투자, 트레이딩 또는 기타 유형의 조언이나 권장 사항으로 간주되지 않으며, 트레이딩뷰에서 제공하거나 보증하는 것이 아닙니다. 자세한 내용은 이용 약관을 참조하세요.