INVITE-ONLY SCRIPT
업데이트됨 RSI-2
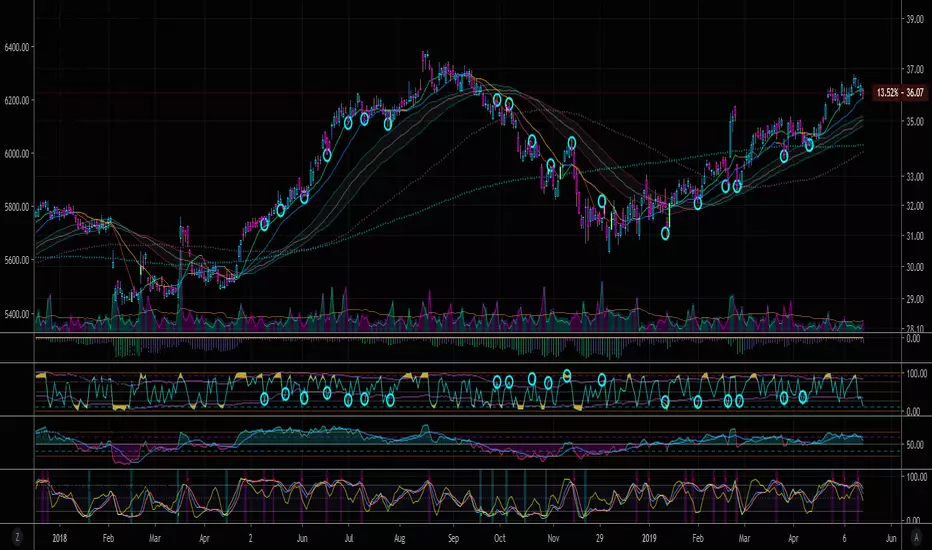
RSI-2 is an RSI indicator based on 2 periods.
It is used to locate pull back points within a major trend.
These points will generally offer the best risk/reward entry areas.
OB is >90
OS is <10
In an uptrend, long, when RSI-2 is OS
In a downtrend, short, when RSI-2 is OB
Start with 1D chart,
If RSI-2 gives too many signals (false signals) then use higher time frame, such as 3D
If RSi-2 gives not enough signals, then use a lower time frame, such as 3HR
For more information on RSI-2, read "Short term trading strategies that work"-by larry connors, chapter 9
릴리즈 노트
Updated version.Bollinger bands activated, to fix the prior issue where RSI-2 indicator was not sensitive enough on the current time frame to reach OS (<10) & OB (>90) areas.
With the bolinger bands, it effectively creates a corridor channel to use as OB & OS.
Bolinger band for RSI-2 uses 1 std dev over 31 periods.
traditional bolinger bands are based on: 2 std dev over 20 period ,
tradition TDI is based on: 1.618 std dev over 31 peroids
릴리즈 노트
update릴리즈 노트
update릴리즈 노트
update릴리즈 노트
update릴리즈 노트
update초대 전용 스크립트
이 스크립트는 작성자가 승인한 사용자만 접근할 수 있습니다. 사용하려면 요청 후 승인을 받아야 하며, 일반적으로 결제 후에 허가가 부여됩니다. 자세한 내용은 아래 작성자의 안내를 따르거나 provalesco에게 직접 문의하세요.
트레이딩뷰는 스크립트의 작동 방식을 충분히 이해하고 작성자를 완전히 신뢰하지 않는 이상, 해당 스크립트에 비용을 지불하거나 사용하는 것을 권장하지 않습니다. 커뮤니티 스크립트에서 무료 오픈소스 대안을 찾아보실 수도 있습니다.
작성자 지시 사항
면책사항
해당 정보와 게시물은 금융, 투자, 트레이딩 또는 기타 유형의 조언이나 권장 사항으로 간주되지 않으며, 트레이딩뷰에서 제공하거나 보증하는 것이 아닙니다. 자세한 내용은 이용 약관을 참조하세요.
초대 전용 스크립트
이 스크립트는 작성자가 승인한 사용자만 접근할 수 있습니다. 사용하려면 요청 후 승인을 받아야 하며, 일반적으로 결제 후에 허가가 부여됩니다. 자세한 내용은 아래 작성자의 안내를 따르거나 provalesco에게 직접 문의하세요.
트레이딩뷰는 스크립트의 작동 방식을 충분히 이해하고 작성자를 완전히 신뢰하지 않는 이상, 해당 스크립트에 비용을 지불하거나 사용하는 것을 권장하지 않습니다. 커뮤니티 스크립트에서 무료 오픈소스 대안을 찾아보실 수도 있습니다.
작성자 지시 사항
면책사항
해당 정보와 게시물은 금융, 투자, 트레이딩 또는 기타 유형의 조언이나 권장 사항으로 간주되지 않으며, 트레이딩뷰에서 제공하거나 보증하는 것이 아닙니다. 자세한 내용은 이용 약관을 참조하세요.