OPEN-SOURCE SCRIPT
업데이트됨 Single Candle Model-DTFX
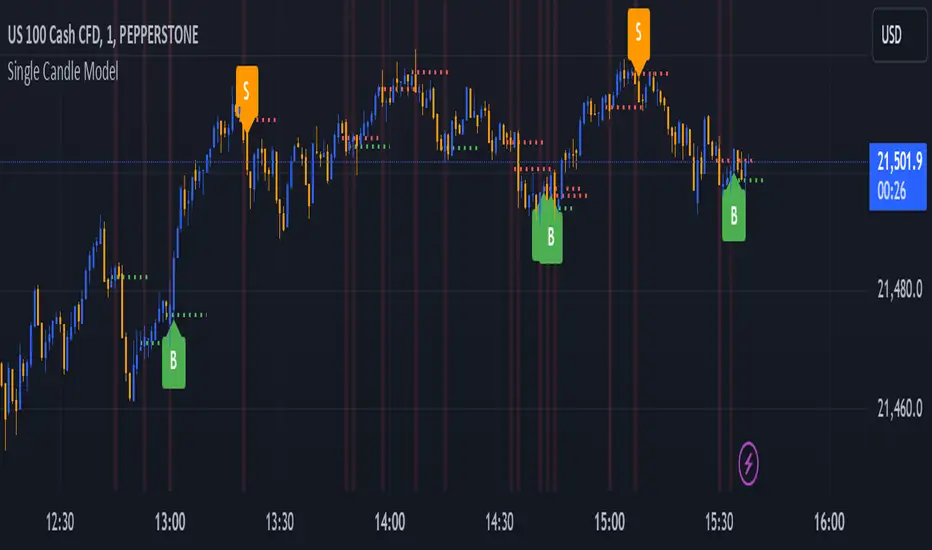
The script identifies the candles with engulfing body and marks the 50% of the candle for easy entry based on model of #DTFX single candle entry
Interpreting the Signals:
Look for candles labeled as "BE". These represent significant price action where the range is larger than the previous candle's range.
Pay attention to the 50% line of the "BE" candle:
A green line indicates a bullish "BE" candle.
A red line indicates a bearish "BE" candle.
Watch for Buy ("B") and Sell ("S") labels:
"B": Indicates a potential bullish breakout.
"S": Indicates a potential bearish breakdown.
Alerts:
Configure alerts in TradingView to notify you whenever a "B" or "S" signal is detected. This allows you to act on the signals without constantly monitoring the chart.
Use in Trading Strategies:
Combine this indicator with other tools like support/resistance levels, moving averages, or trend analysis to validate the signals.
Use the midpoint (50% line) of the "BE" candle as a potential reference point for stop-loss or target levels.
Customizations:
Adjust the appearance of labels and lines by modifying their style, color, or placement in the script.
Add filters (e.g., timeframes or volume conditions) to refine the detection of "BE" candles.
This indicator helps traders identify pivotal price movements and act on potential breakouts or breakdowns with clear visual markers and alerts.
릴리즈 노트
updated for the overlay오픈 소스 스크립트
트레이딩뷰의 진정한 정신에 따라, 이 스크립트의 작성자는 이를 오픈소스로 공개하여 트레이더들이 기능을 검토하고 검증할 수 있도록 했습니다. 작성자에게 찬사를 보냅니다! 이 코드는 무료로 사용할 수 있지만, 코드를 재게시하는 경우 하우스 룰이 적용된다는 점을 기억하세요.
면책사항
해당 정보와 게시물은 금융, 투자, 트레이딩 또는 기타 유형의 조언이나 권장 사항으로 간주되지 않으며, 트레이딩뷰에서 제공하거나 보증하는 것이 아닙니다. 자세한 내용은 이용 약관을 참조하세요.
오픈 소스 스크립트
트레이딩뷰의 진정한 정신에 따라, 이 스크립트의 작성자는 이를 오픈소스로 공개하여 트레이더들이 기능을 검토하고 검증할 수 있도록 했습니다. 작성자에게 찬사를 보냅니다! 이 코드는 무료로 사용할 수 있지만, 코드를 재게시하는 경우 하우스 룰이 적용된다는 점을 기억하세요.
면책사항
해당 정보와 게시물은 금융, 투자, 트레이딩 또는 기타 유형의 조언이나 권장 사항으로 간주되지 않으며, 트레이딩뷰에서 제공하거나 보증하는 것이 아닙니다. 자세한 내용은 이용 약관을 참조하세요.