PROTECTED SOURCE SCRIPT
My_EMA_Trend v. 6.1
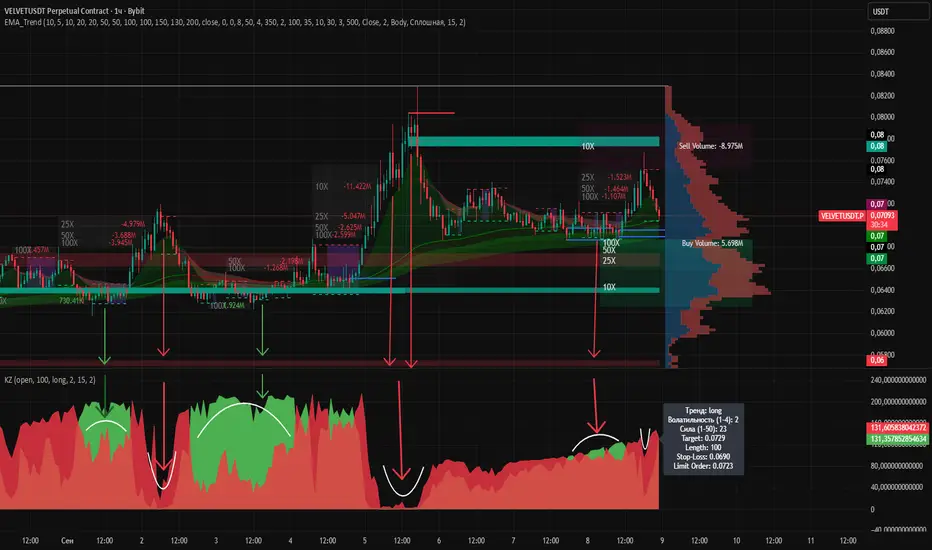
This script is a comprehensive trading indicator that includes several functional modules. Here is a brief description of its main functions:
Consolidation Zones
Detects and displays consolidation zones on the chart
Marks price accumulation areas
Generates breakout alerts (up/down)
Allows customization of analysis period and minimum consolidation length
EMA Clouds
Contains 5 sets of EMA clouds with different periods
Each cloud consists of short and long EMAs
Displays 10 exponential moving averages
Cloud colors change depending on trend direction
Customizable periods and visual parameters
Support/Resistance Levels
Automatically detects key levels
Uses ATR to calculate distances
Draws support and resistance zones
Has a function to extend recent levels
Customizable color schemes
Volume Indicator
Shows volume distribution across price levels
Visualizes buying and selling volume
Displays Point of Control (PoC)
Customizable number of histograms
Adjustable display width
Liquidation Zones
Identifies potential areas of mass position liquidations
Displays levels with different multipliers (10x, 25x, 50x, 100x)
Shows position volume
Includes a heatmap feature
Option to extend displayed zones
The script provides traders with a comprehensive set of tools for market analysis, including technical analysis, volume analysis, and key level identification. All components can be customized to meet individual user needs.
Best usage with my KZ
https://www.tradingview.com/x/gtp3hGoI/
보호된 스크립트입니다
이 스크립트는 비공개 소스로 게시됩니다. 하지만 제한 없이 자유롭게 사용할 수 있습니다 — 여기에서 자세히 알아보기.
면책사항
이 정보와 게시물은 TradingView에서 제공하거나 보증하는 금융, 투자, 거래 또는 기타 유형의 조언이나 권고 사항을 의미하거나 구성하지 않습니다. 자세한 내용은 이용 약관을 참고하세요.
면책사항
이 정보와 게시물은 TradingView에서 제공하거나 보증하는 금융, 투자, 거래 또는 기타 유형의 조언이나 권고 사항을 의미하거나 구성하지 않습니다. 자세한 내용은 이용 약관을 참고하세요.