OPEN-SOURCE SCRIPT
Strategy Myth-Busting #6 - PSAR+MA+SQZMOM+HVI - [MYN]

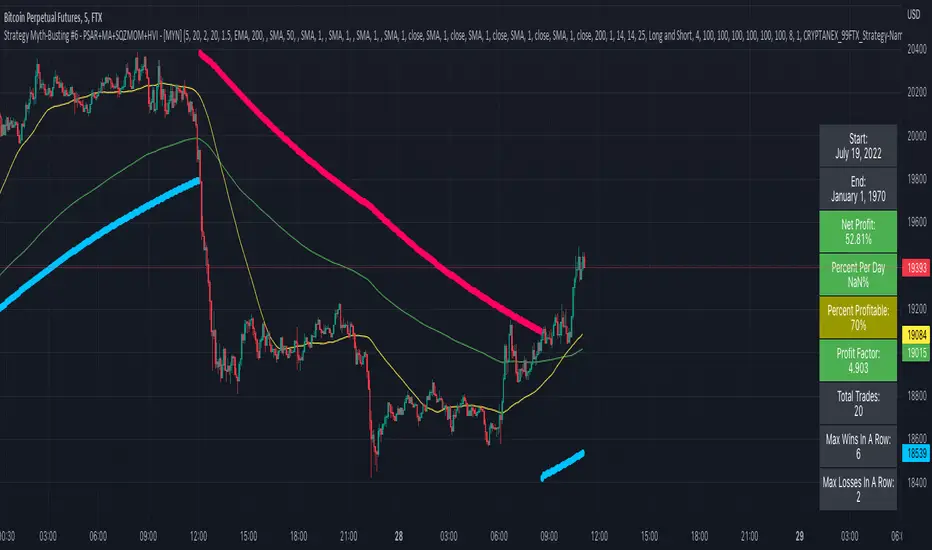
This is part of a new series we are calling "Strategy Myth-Busting" where we take open public manual trading strategies and automate them. The goal is to not only validate the authenticity of the claims but to provide an automated version for traders who wish to trade autonomously.
Our sixth one we are automating is "I Tested ''7% Profit Per Day" Scalping Strategy 100 Times ( Unexpected Results )" from "TradeIQ" which claims to have made 175% profit on the 5 min chart of BTCUSD with a having a 61% win rate in just 32 days.
Originally, we mimicked verbatim the indicators and settings TradeIQ was using however weren't getting promising results anything close to the claim so we decided to try and improve on it. We changed the static Parabolic SAR to be adaptive based upon the timeframe. We did this by using an adjustable multiplier for the PSAR Max. Also, In TradeIQ's revised version he substituted Hawkeye's Volume Indicator in lieu of Squeeze Momentum. We found that including both indicators we were getting better results so included them both. Feel free to experiment more. Would love to see how this could be improved on.
This strategy uses a combination of 4 open-source public indicators:
Trading Rules
5m timeframe and above. We saw equally good results in the higher (3h - 4h) timeframes as well.
Long Entry:
Short Entry:
If you know of or have a strategy you want to see myth-busted or just have an idea for one, please feel free to message me.
Our sixth one we are automating is "I Tested ''7% Profit Per Day" Scalping Strategy 100 Times ( Unexpected Results )" from "TradeIQ" which claims to have made 175% profit on the 5 min chart of BTCUSD with a having a 61% win rate in just 32 days.
Originally, we mimicked verbatim the indicators and settings TradeIQ was using however weren't getting promising results anything close to the claim so we decided to try and improve on it. We changed the static Parabolic SAR to be adaptive based upon the timeframe. We did this by using an adjustable multiplier for the PSAR Max. Also, In TradeIQ's revised version he substituted Hawkeye's Volume Indicator in lieu of Squeeze Momentum. We found that including both indicators we were getting better results so included them both. Feel free to experiment more. Would love to see how this could be improved on.
This strategy uses a combination of 4 open-source public indicators:
- Parabolic Sar (built in)
- 10 in 1 MA's by hiimannshu
- Squeeze Momentum by lazybear
- HawkEYE Volume Indicator by lazybear
Trading Rules
5m timeframe and above. We saw equally good results in the higher (3h - 4h) timeframes as well.
Long Entry:
- Parabolic Sar shifts below price at last dot above and then previous bar needs to breach above that.
- Price action has to be below both MA's and 50MA needs to be above 200MA
- Squeeze Momentum needsd to be in green or close to going green
- HawkEYE Volume Indicator needs to be show a green bar on the histagram
Short Entry:
- Parabolic Sar shifts above price at last dot below and then previous bar needs to breach below that.
- Price action needs to be above both MA's and 50MA needs to be below 200MA
- Squeeze Momentum needsd to be in red or close to going red
- HawkEYE Volume Indicator needs to be show a red bar on the histagram
If you know of or have a strategy you want to see myth-busted or just have an idea for one, please feel free to message me.
릴리즈 노트
Fixed High/Low PSAR entry logic오픈 소스 스크립트
트레이딩뷰의 진정한 정신에 따라, 이 스크립트의 작성자는 이를 오픈소스로 공개하여 트레이더들이 기능을 검토하고 검증할 수 있도록 했습니다. 작성자에게 찬사를 보냅니다! 이 코드는 무료로 사용할 수 있지만, 코드를 재게시하는 경우 하우스 룰이 적용된다는 점을 기억하세요.
If you're interested in exploring and discovering other high quality free strategies come join us in Discord: discord.gg/2wkm9QqSuY
➖➖🟦➖➖➖🟦
➖🟦🟦🟦🟦🟦🟦🟦
➖🟦🟦🟦🟦🟦🟦🟦
🟦🟦⬜️⬜️🟦⬜️⬜️🟦🟦
🟦🟦⬜️⬜️🟦⬜️⬜️🟦🟦
🟦🟦🟦🟦🟦🟦🟦🟦🟦
➖🟦🟦➖➖➖🟦🟦
➖➖🟦➖➖➖🟦
➖🟦🟦🟦🟦🟦🟦🟦
➖🟦🟦🟦🟦🟦🟦🟦
🟦🟦⬜️⬜️🟦⬜️⬜️🟦🟦
🟦🟦⬜️⬜️🟦⬜️⬜️🟦🟦
🟦🟦🟦🟦🟦🟦🟦🟦🟦
➖🟦🟦➖➖➖🟦🟦
면책사항
해당 정보와 게시물은 금융, 투자, 트레이딩 또는 기타 유형의 조언이나 권장 사항으로 간주되지 않으며, 트레이딩뷰에서 제공하거나 보증하는 것이 아닙니다. 자세한 내용은 이용 약관을 참조하세요.
오픈 소스 스크립트
트레이딩뷰의 진정한 정신에 따라, 이 스크립트의 작성자는 이를 오픈소스로 공개하여 트레이더들이 기능을 검토하고 검증할 수 있도록 했습니다. 작성자에게 찬사를 보냅니다! 이 코드는 무료로 사용할 수 있지만, 코드를 재게시하는 경우 하우스 룰이 적용된다는 점을 기억하세요.
If you're interested in exploring and discovering other high quality free strategies come join us in Discord: discord.gg/2wkm9QqSuY
➖➖🟦➖➖➖🟦
➖🟦🟦🟦🟦🟦🟦🟦
➖🟦🟦🟦🟦🟦🟦🟦
🟦🟦⬜️⬜️🟦⬜️⬜️🟦🟦
🟦🟦⬜️⬜️🟦⬜️⬜️🟦🟦
🟦🟦🟦🟦🟦🟦🟦🟦🟦
➖🟦🟦➖➖➖🟦🟦
➖➖🟦➖➖➖🟦
➖🟦🟦🟦🟦🟦🟦🟦
➖🟦🟦🟦🟦🟦🟦🟦
🟦🟦⬜️⬜️🟦⬜️⬜️🟦🟦
🟦🟦⬜️⬜️🟦⬜️⬜️🟦🟦
🟦🟦🟦🟦🟦🟦🟦🟦🟦
➖🟦🟦➖➖➖🟦🟦
면책사항
해당 정보와 게시물은 금융, 투자, 트레이딩 또는 기타 유형의 조언이나 권장 사항으로 간주되지 않으며, 트레이딩뷰에서 제공하거나 보증하는 것이 아닙니다. 자세한 내용은 이용 약관을 참조하세요.