OPEN-SOURCE SCRIPT
업데이트됨 Z Score CANDLE and Exciting candle signal [DJ D]

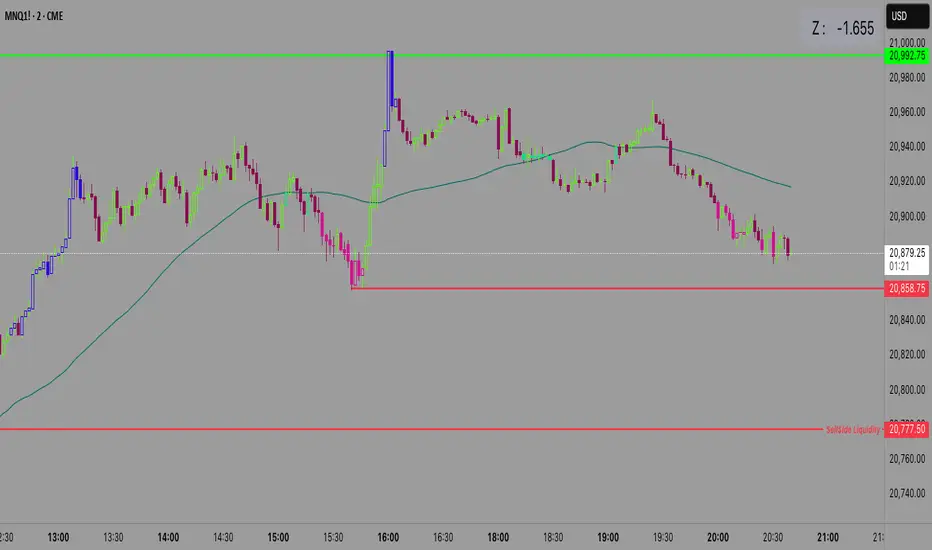
This script paints candles when their zscore reaches above 2 standard deviations in price from the mean. The blue candle represents up candle above 2. Magenta candle below -2. The candles can signal the beginning of a move and also importantly exhaustion.
The script also signals when a candle has volatility above 6. The higher the sensitivity the less frequent it will paint. These are real time paints and signals. You can adjust for higher time frames by adjusting the length of the z score and adjust the sensitivity of the volatility candles.
The yellow candle is a mean candle and can signify consolidation and/or indecision. Drawing a Darvis type box around around mean candles can give you a zone to watch.
These settings are for 1 minute scalping. The volatility sensitivity range between 1- 2 is good for 15, 30, (ie 1.0 or 1.2) and your discretion....
릴리즈 노트
Fixed length of Z score to 60 which is better default.Added table with color change for easier navigation
오픈 소스 스크립트
트레이딩뷰의 진정한 정신에 따라, 이 스크립트의 작성자는 이를 오픈소스로 공개하여 트레이더들이 기능을 검토하고 검증할 수 있도록 했습니다. 작성자에게 찬사를 보냅니다! 이 코드는 무료로 사용할 수 있지만, 코드를 재게시하는 경우 하우스 룰이 적용된다는 점을 기억하세요.
면책사항
해당 정보와 게시물은 금융, 투자, 트레이딩 또는 기타 유형의 조언이나 권장 사항으로 간주되지 않으며, 트레이딩뷰에서 제공하거나 보증하는 것이 아닙니다. 자세한 내용은 이용 약관을 참조하세요.
오픈 소스 스크립트
트레이딩뷰의 진정한 정신에 따라, 이 스크립트의 작성자는 이를 오픈소스로 공개하여 트레이더들이 기능을 검토하고 검증할 수 있도록 했습니다. 작성자에게 찬사를 보냅니다! 이 코드는 무료로 사용할 수 있지만, 코드를 재게시하는 경우 하우스 룰이 적용된다는 점을 기억하세요.
면책사항
해당 정보와 게시물은 금융, 투자, 트레이딩 또는 기타 유형의 조언이나 권장 사항으로 간주되지 않으며, 트레이딩뷰에서 제공하거나 보증하는 것이 아닙니다. 자세한 내용은 이용 약관을 참조하세요.