OPEN-SOURCE SCRIPT
Defu_Divergence
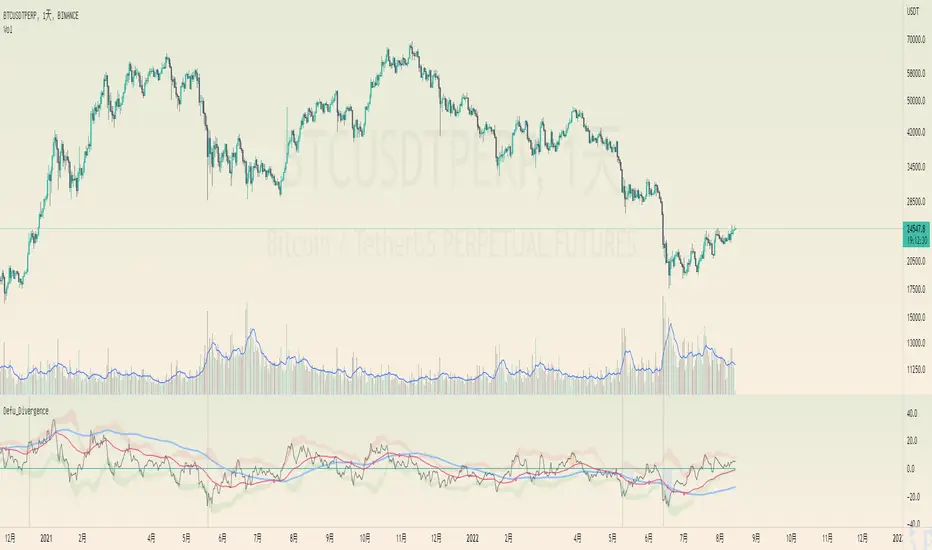
This is a composite indicator, a collection of multiple indicators
It includes the following:
1. the gray background has a huge trading volume ,
2. the market cost deviates, and the relationship between the closing price of the black line, the red line and the blue line and the short-term, medium-term and long-term average. Compare the difference after mutual subtraction.
3. blue orange column fund flow indicator MFI , color transparency indicates the value
4. the Bollinger belt signals with a short deviation rate, which is the Bollinger belt with a black line.
======================The above translation is from Google
这是一个复合指标,集合了多种指标
包括以下:
1.灰色背景成交量巨大,
2.市场成本乖离 ,黑色线、红色线、蓝色线收盘价与 短期 、中期、长期三条均线之间的关系。互减后比较差值。
3.蓝橙柱 资金流量指标MFI,颜色的透明度表示值的大小
4.布林带 以短期乖离率信号,就是黑色线的布林带。
오픈 소스 스크립트
트레이딩뷰의 진정한 정신에 따라, 이 스크립트의 작성자는 이를 오픈소스로 공개하여 트레이더들이 기능을 검토하고 검증할 수 있도록 했습니다. 작성자에게 찬사를 보냅니다! 이 코드는 무료로 사용할 수 있지만, 코드를 재게시하는 경우 하우스 룰이 적용된다는 점을 기억하세요.
면책사항
해당 정보와 게시물은 금융, 투자, 트레이딩 또는 기타 유형의 조언이나 권장 사항으로 간주되지 않으며, 트레이딩뷰에서 제공하거나 보증하는 것이 아닙니다. 자세한 내용은 이용 약관을 참조하세요.
오픈 소스 스크립트
트레이딩뷰의 진정한 정신에 따라, 이 스크립트의 작성자는 이를 오픈소스로 공개하여 트레이더들이 기능을 검토하고 검증할 수 있도록 했습니다. 작성자에게 찬사를 보냅니다! 이 코드는 무료로 사용할 수 있지만, 코드를 재게시하는 경우 하우스 룰이 적용된다는 점을 기억하세요.
면책사항
해당 정보와 게시물은 금융, 투자, 트레이딩 또는 기타 유형의 조언이나 권장 사항으로 간주되지 않으며, 트레이딩뷰에서 제공하거나 보증하는 것이 아닙니다. 자세한 내용은 이용 약관을 참조하세요.